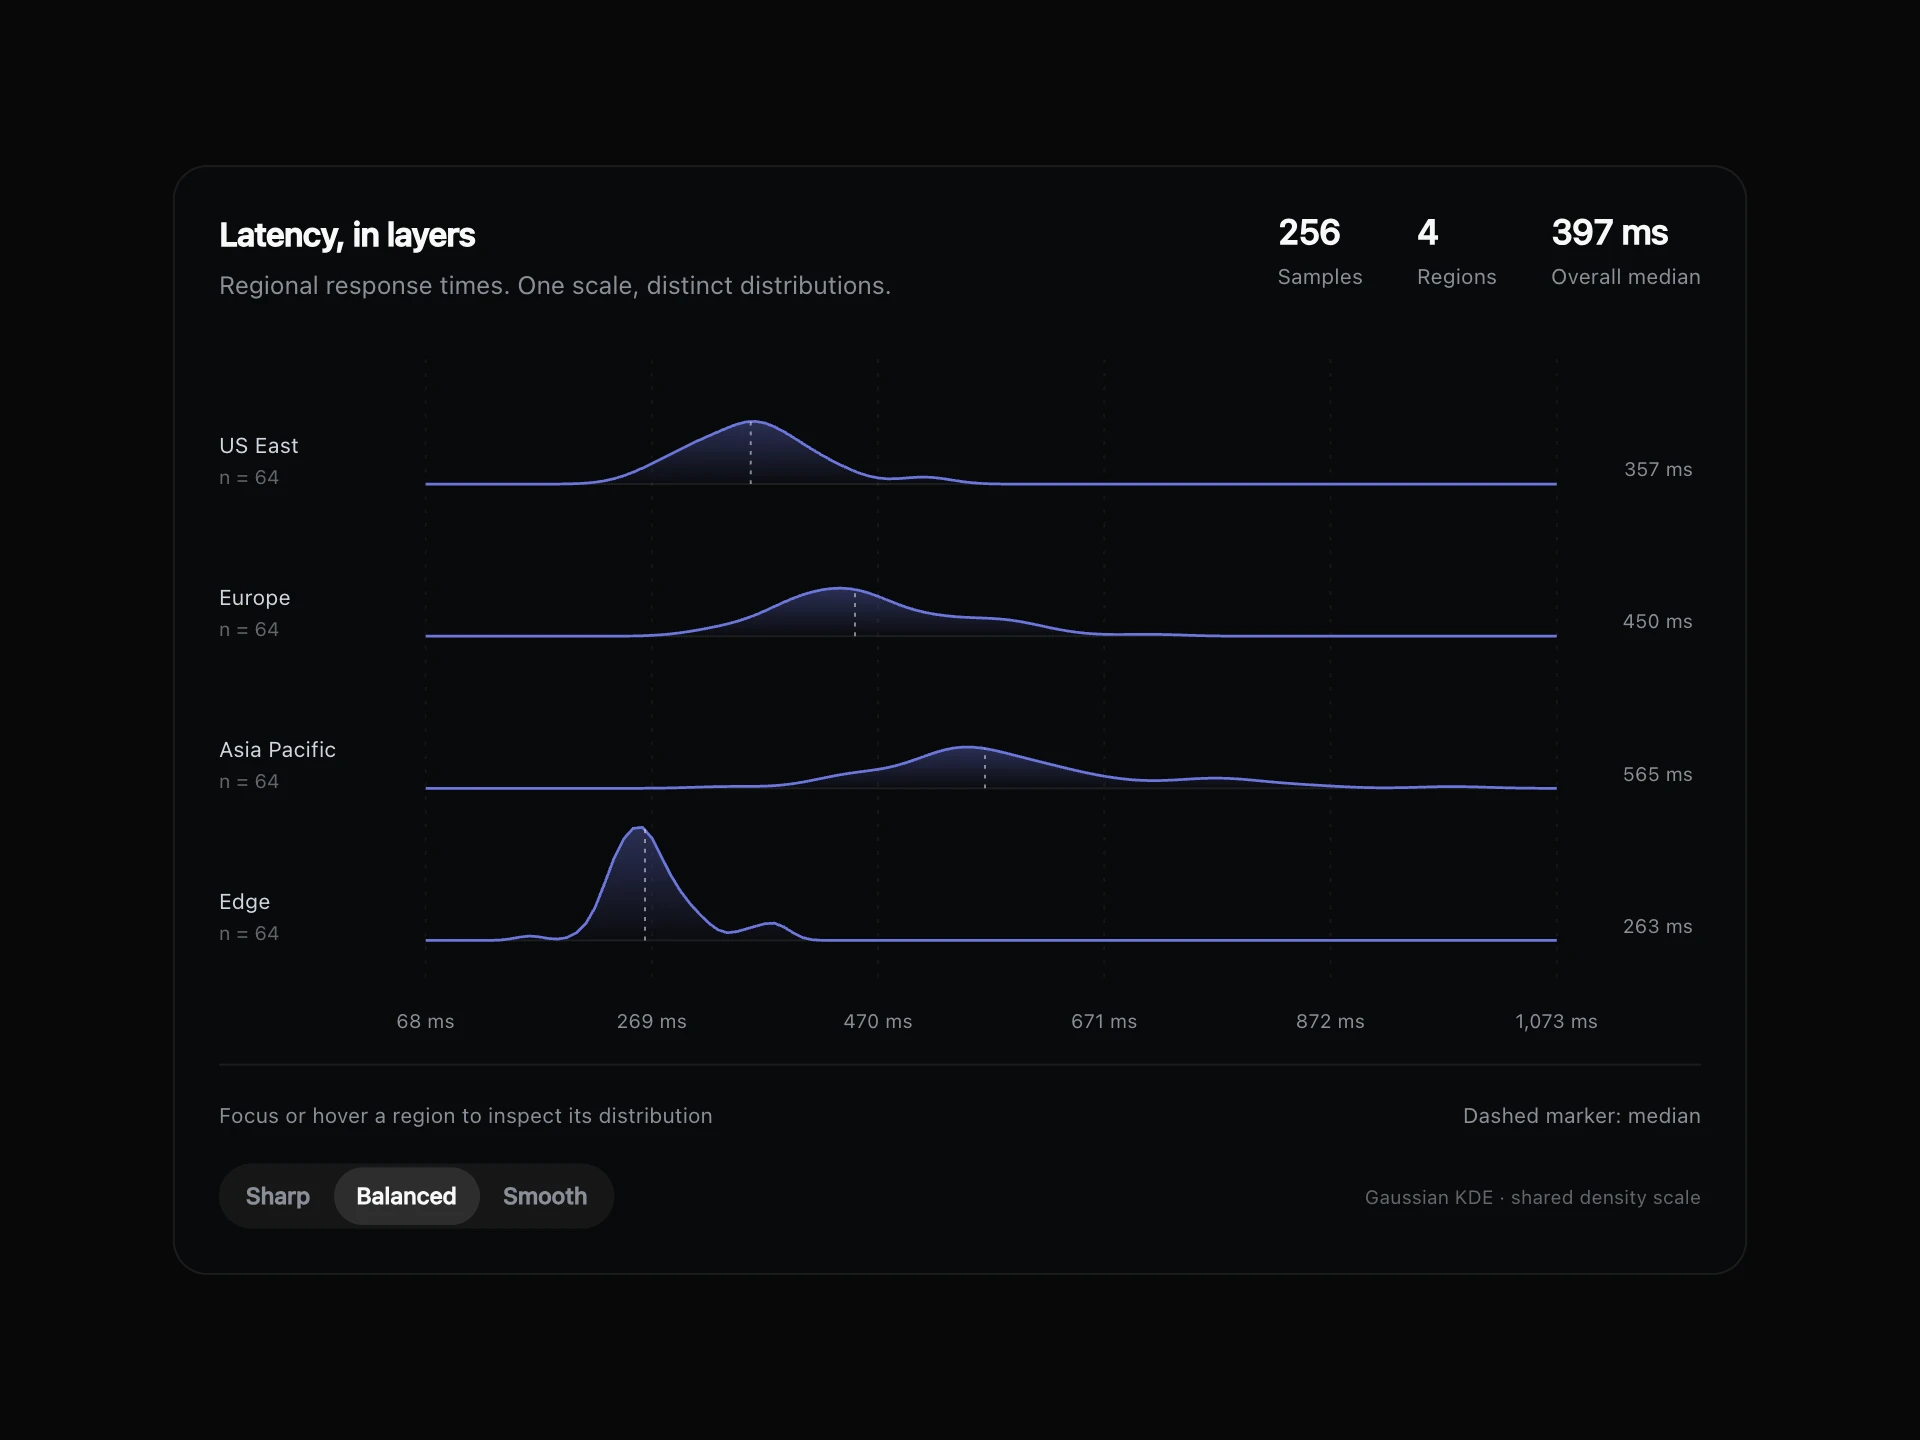
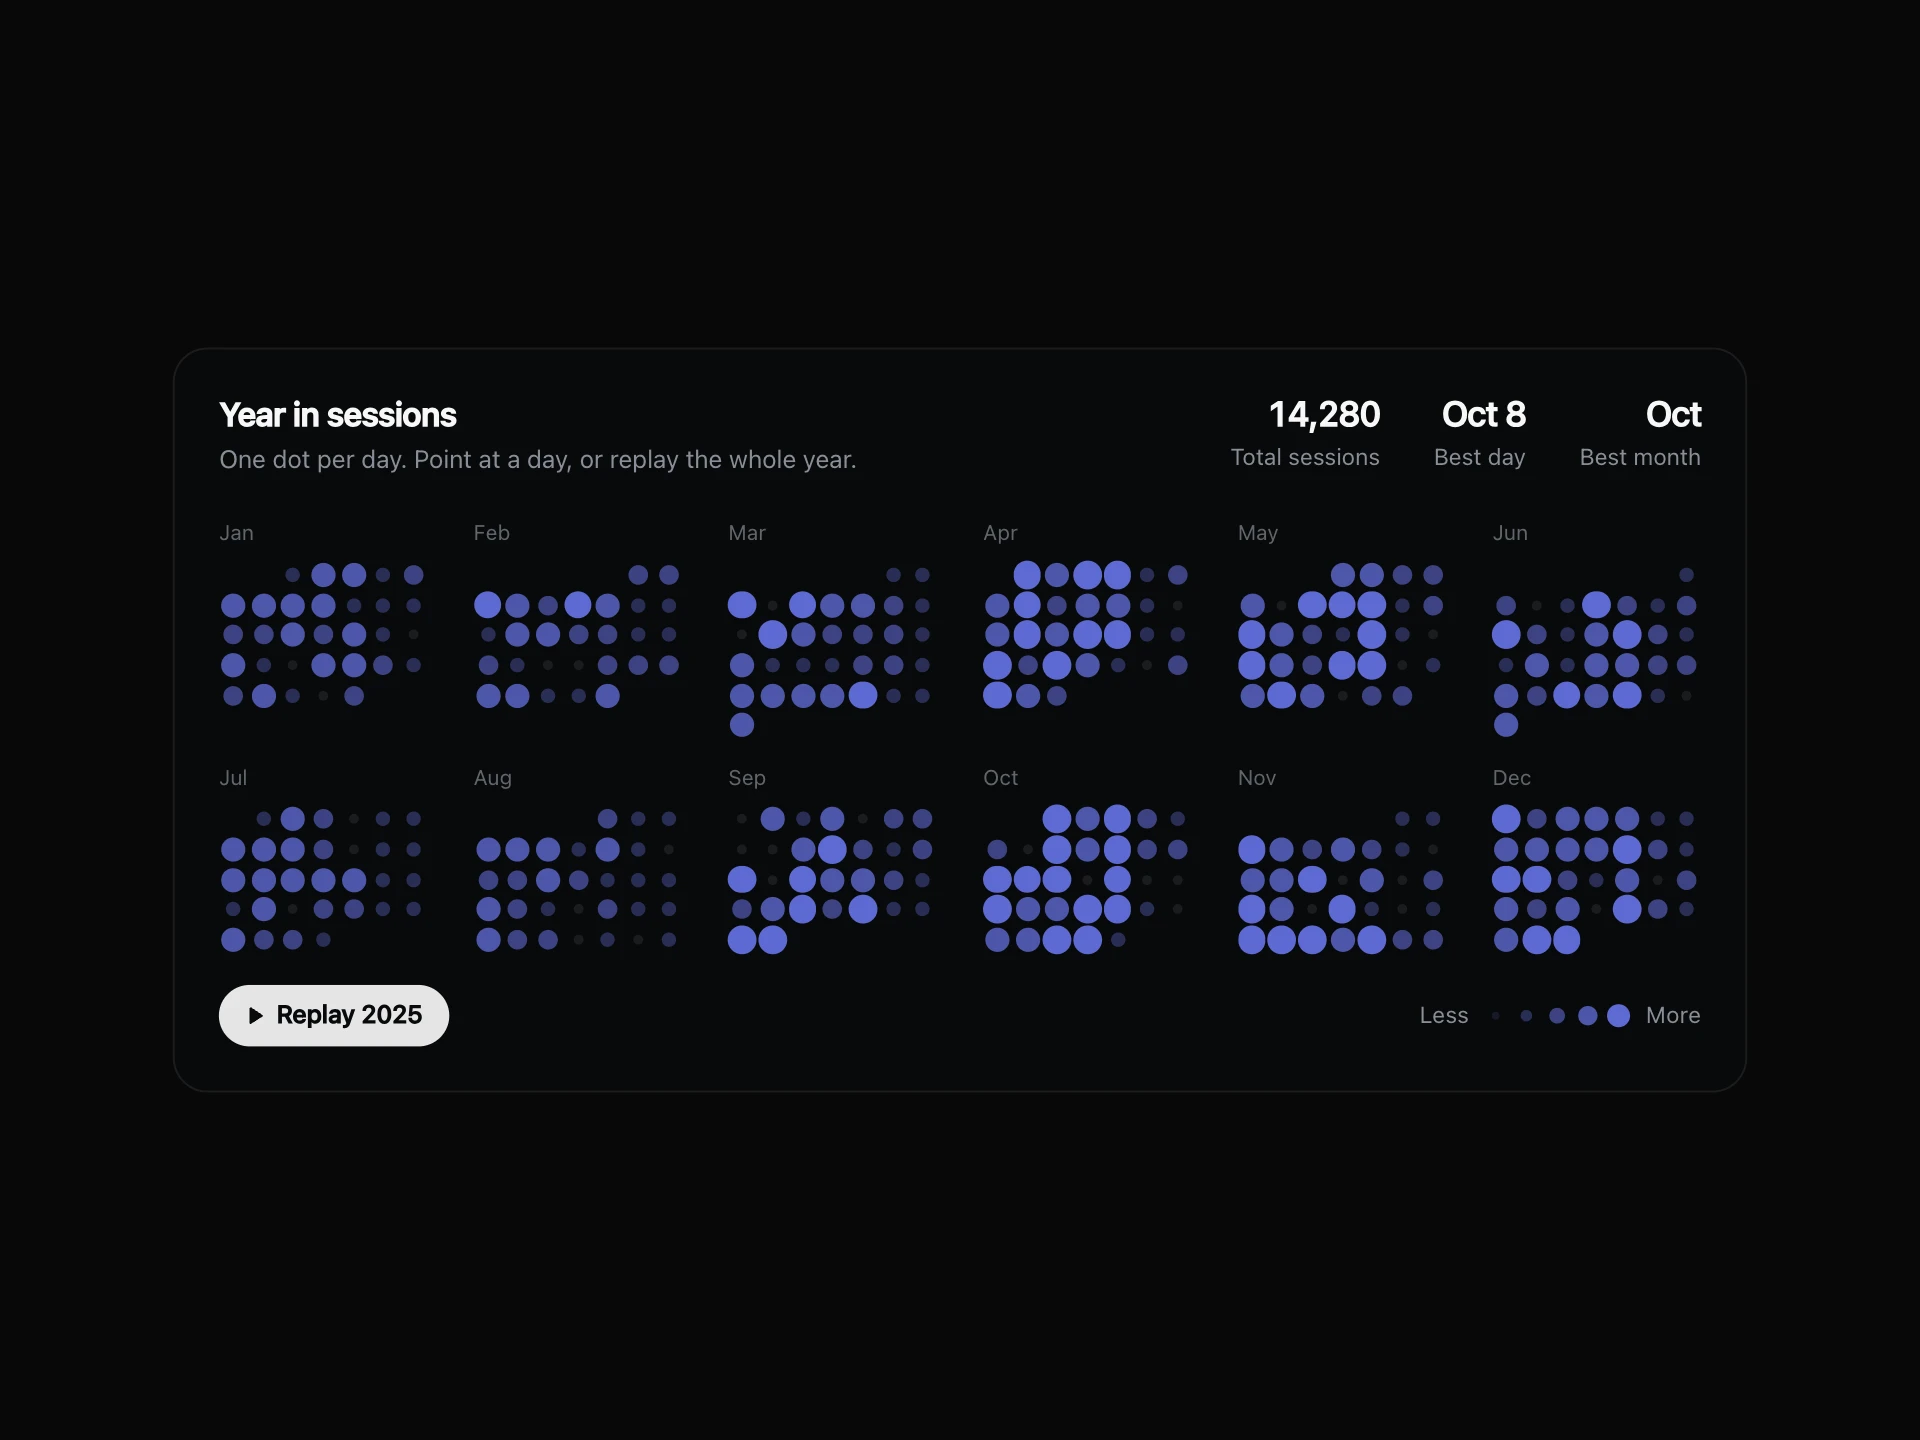
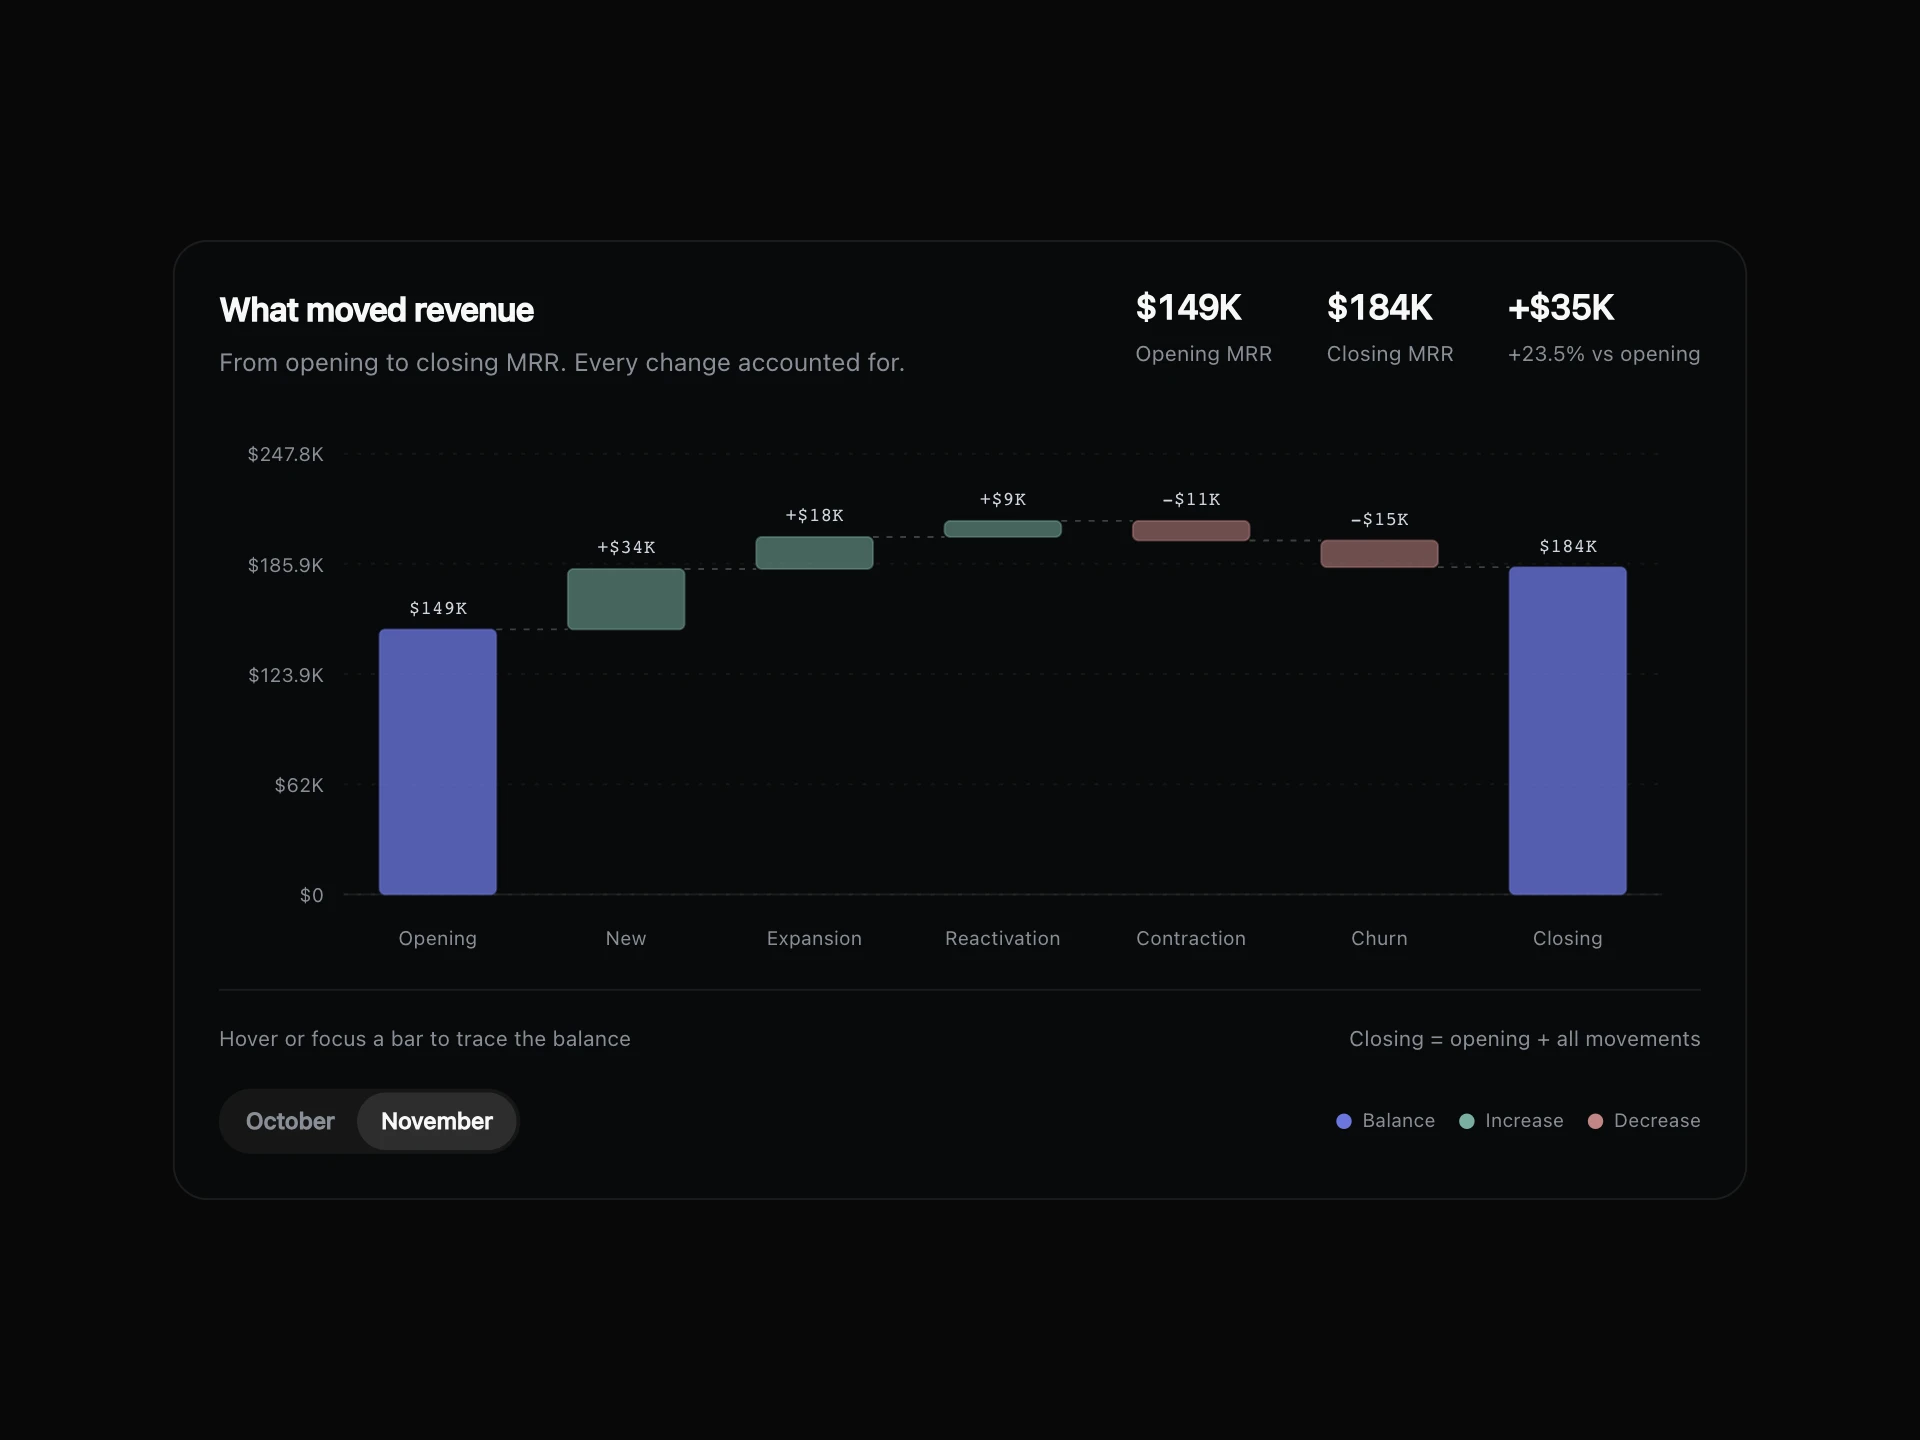
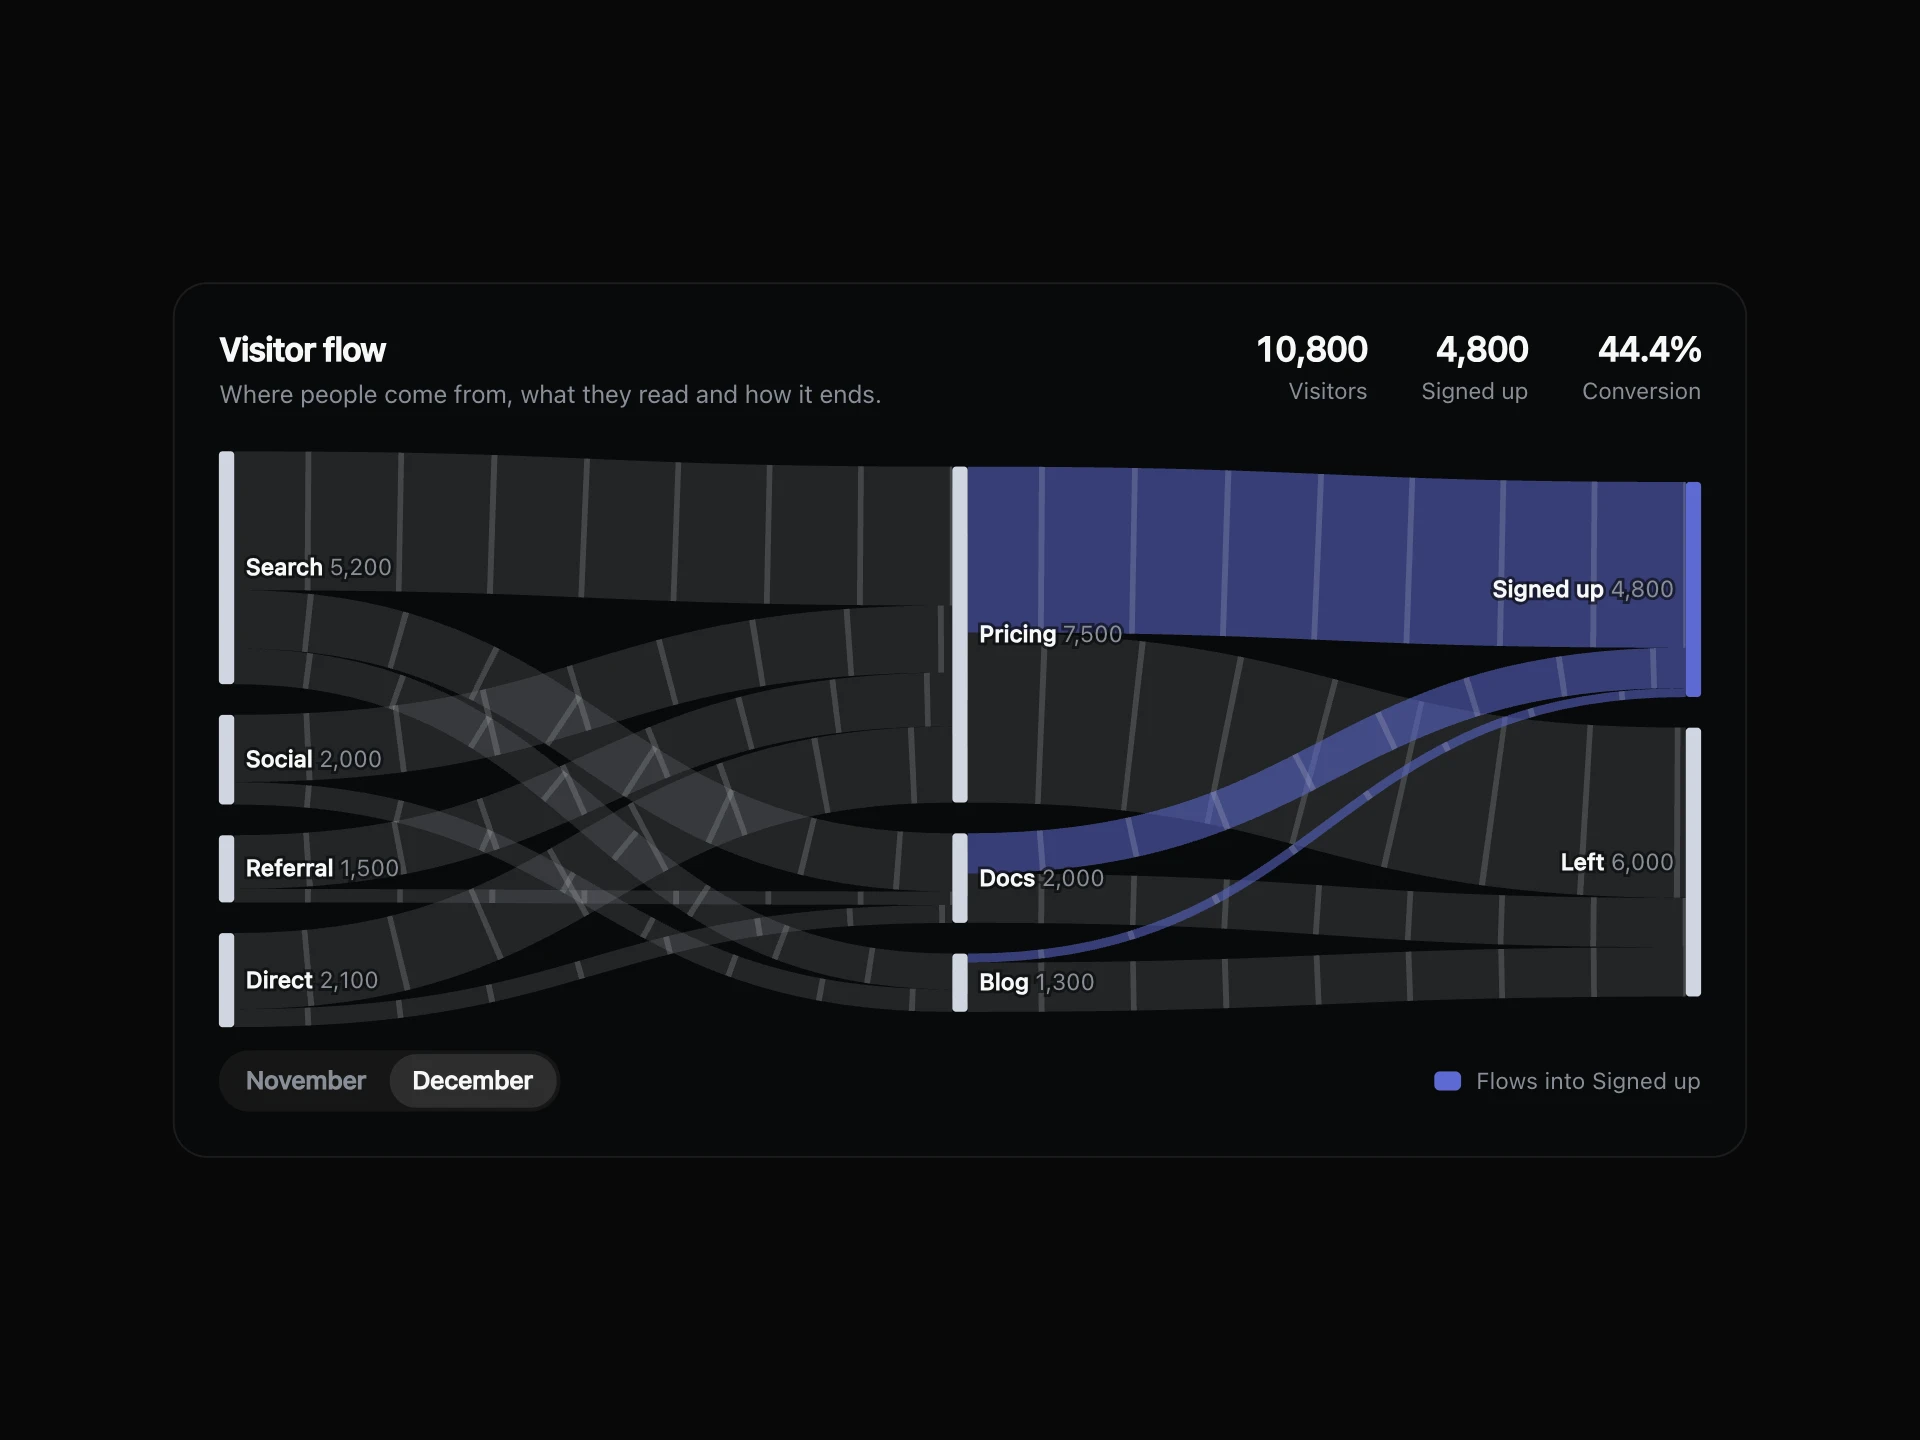
Correlation Matrix Chart React component
An interactive Pearson correlation matrix with pairwise missing-data handling, a diverging color scale, strong-link emphasis and keyboard cell inspection.
About the Correlation Matrix Chart component
Correlation Matrix Chart calculates Pearson coefficients from your observations. Indigo indicates positive relationships and rose indicates negative relationships. Every cell reports its own paired sample count.
When to use it
Explore relationships among product metrics measured over the same observations.
Identify pairs worth investigating with the strong-link emphasis control.
Installation
Add the Correlation Matrix Chart component to your project with the shadcn CLI. It lands in components/correlation-matrix-chart.tsx as plain React + Tailwind CSS source you own and can edit.
npx shadcn@latest add @reactframe/correlation-matrix-chartProps
<CorrelationMatrixChart /> accepts 6 props, all optional. It also accepts the usual <section> attributes, like className, style, id and aria-*, and passes them to its root element.
| Prop | Type | Default |
|---|---|---|
| theme | "dark" | "light" | "dark" |
| title | string | "What moves together" |
| subtitle | string | "Relationships across the metrics that shape your product." |
| metrics | { key: string; label: string }[] | METRICS |
| observations Each row is one observation. Missing/nonfinite pairs are excluded pairwise. | (Record<string, number | null | undefined>)[] | OBSERVATIONS |
| threshold Minimum absolute coefficient to emphasize in Strong links mode. | number | 0.6 |
- theme"dark" | "light"Default: "dark"
- titlestringDefault: "What moves together"
- subtitlestringDefault: "Relationships across the metrics that shape your product."
- metrics{ key: string; label: string }[]Default: METRICS
- observations
Each row is one observation. Missing/nonfinite pairs are excluded pairwise.
(Record<string, number | null | undefined>)[]Default: OBSERVATIONS - threshold
Minimum absolute coefficient to emphasize in Strong links mode.
numberDefault: 0.6
Correlation Matrix Chart FAQ
- How are missing values and constant metrics handled?
- Null, undefined and nonfinite values are omitted independently for each pair. At least two pairs with nonzero variation in both metrics are needed. Constant or insufficient data displays a dash, including on the diagonal.
- How can I inspect the matrix?
- Hover, tap or focus a cell for its coefficient and paired sample count. Arrow keys navigate cells; Home/End go to the first/last cell. Strong links dims coefficients below the absolute threshold. Correlation describes association, not causation.