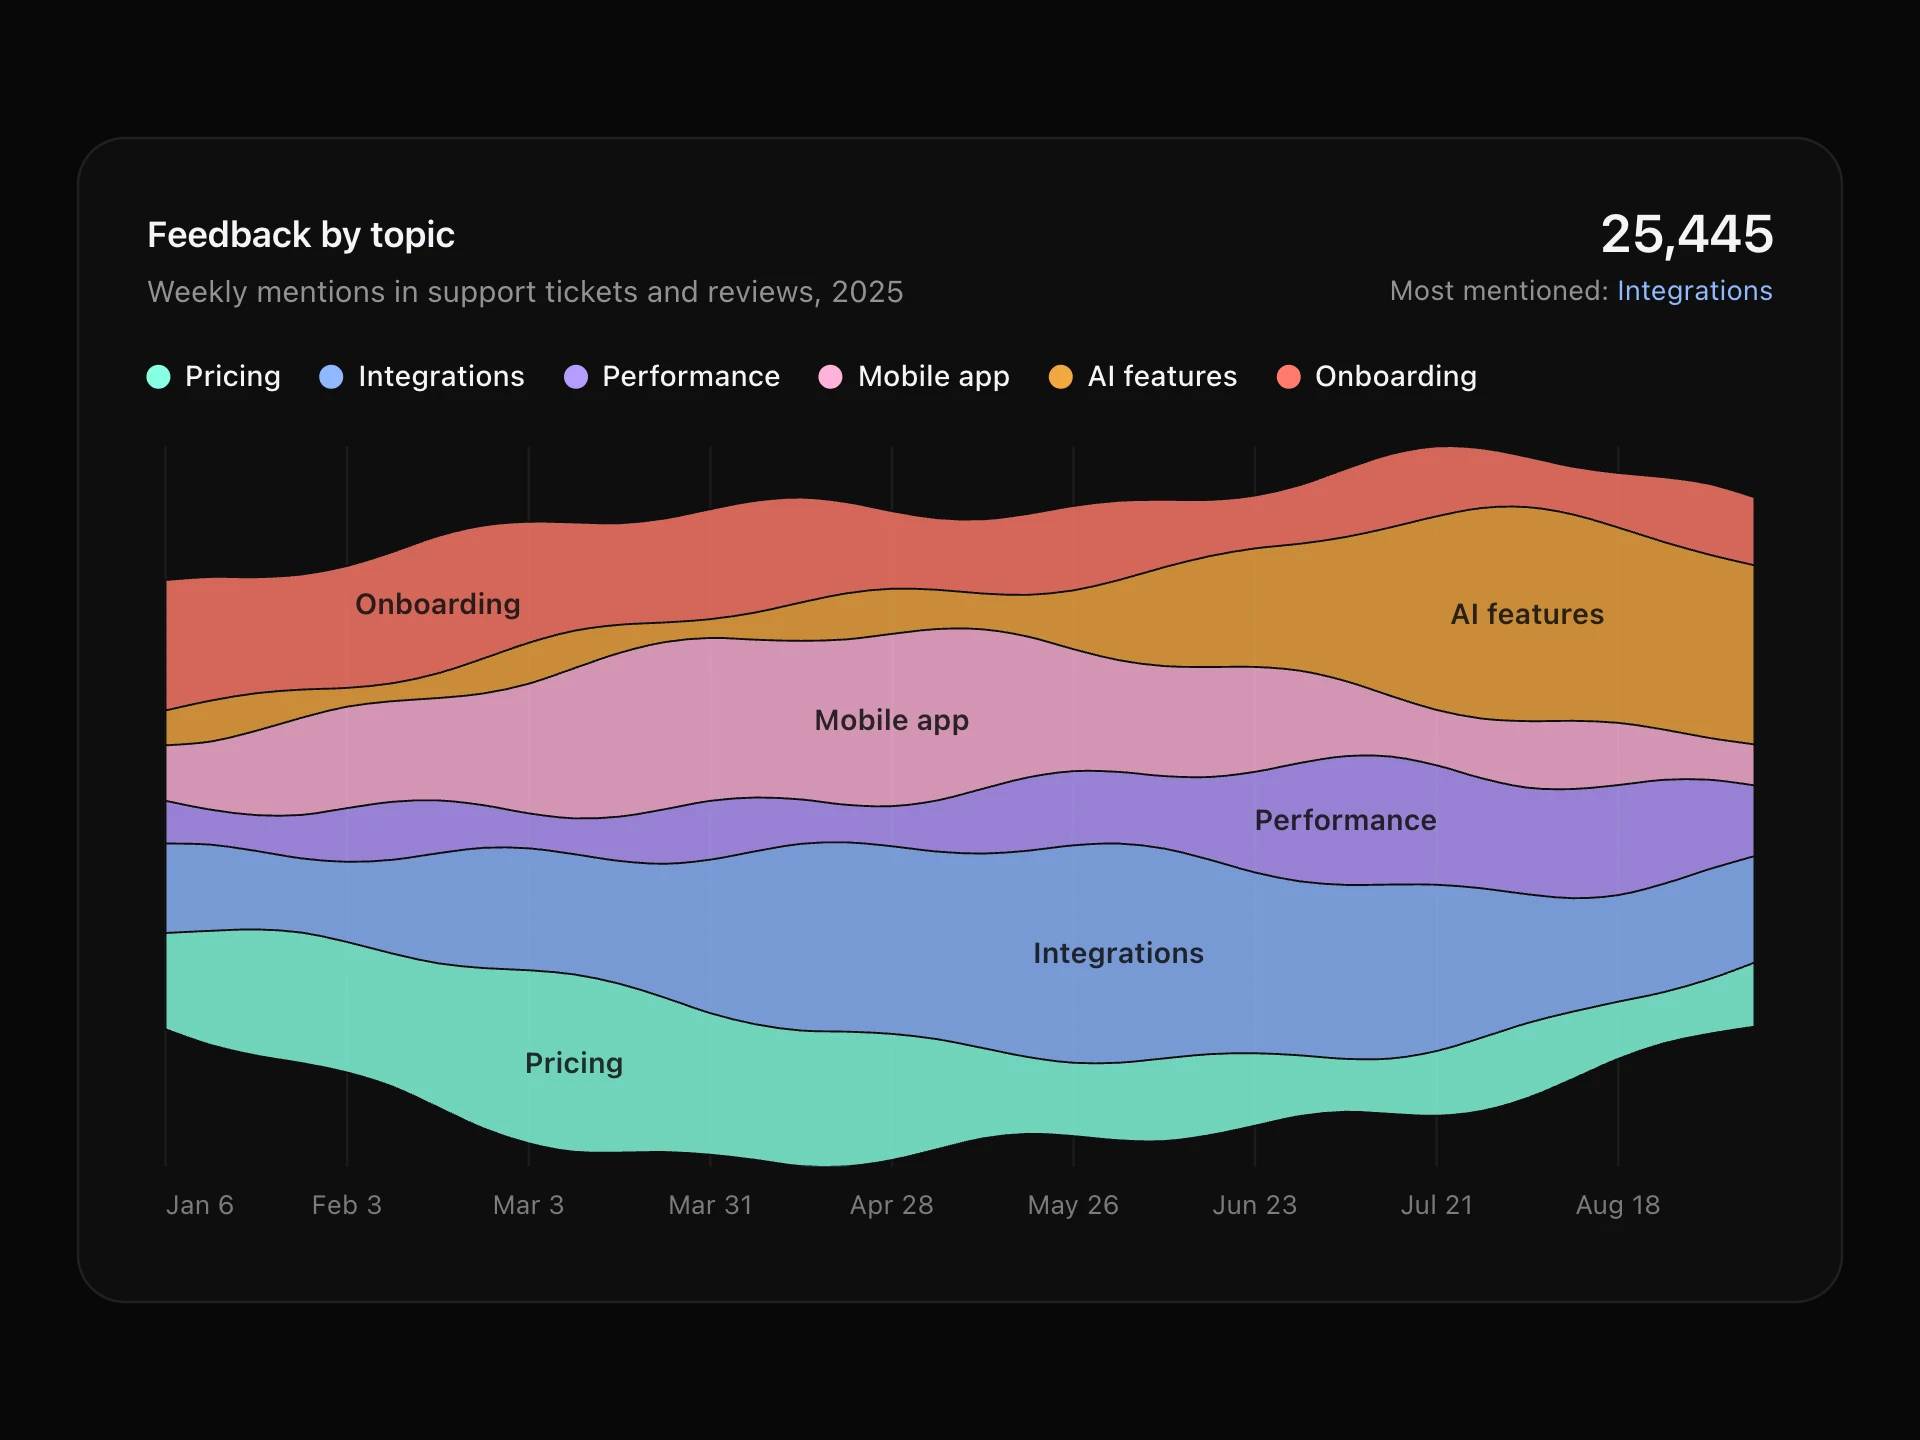
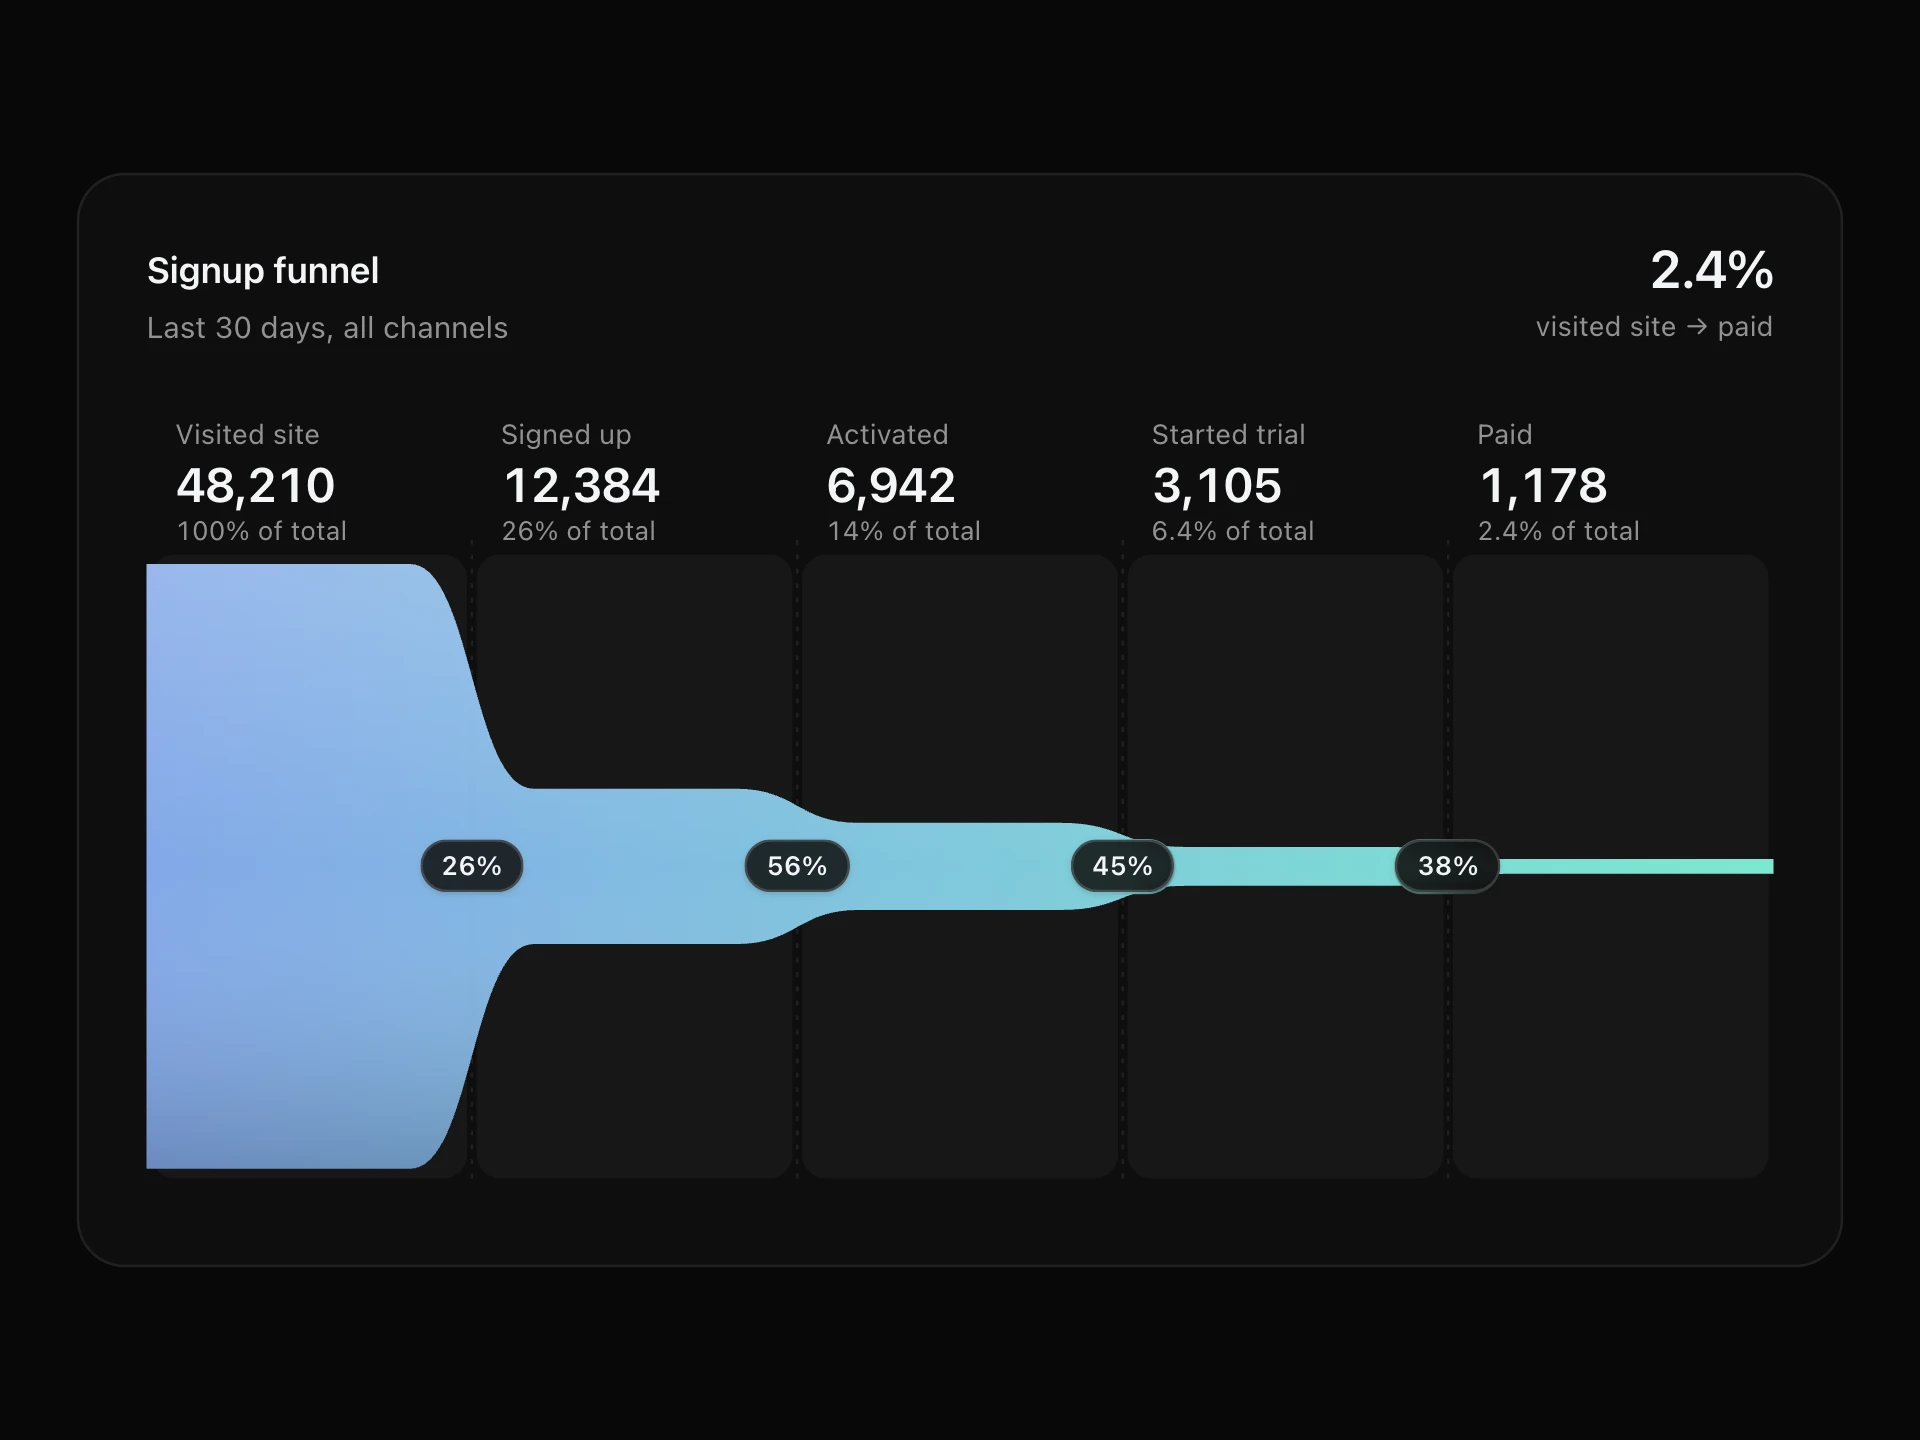
Sankey Diagram React component
A Sankey diagram of how things flow between stages: columns of nodes sized by volume, gradient ribbons whose thickness follows each flow, a layout that untangles crossings, hover highlighting of a node's paths and a tooltip with both shares.
About the Sankey Diagram component
Sankey Diagram shows how a quantity flows through stages: visitors from traffic sources to pages to outcomes, budget from departments to projects, energy from inputs to uses. Each ribbon's thickness is the size of that flow, coloured from where it comes from to where it goes.
The layout arranges nodes to keep ribbons from crossing. Hover or tap a ribbon to see its value and share at both ends, or a node to light up every path through it.
When to use it
Use it for user journeys and traffic attribution, budget and cost allocation, conversion paths that branch, supply chains, and any 'from → to' data with a few stages.
It needs flows that are acyclic (no loops back to an earlier stage). For a single linear flow, a funnel chart is easier to read.
Installation
Add the Sankey Diagram component to your project with the shadcn CLI. It lands in components/sankey-diagram.tsx as plain React + Tailwind CSS source you own and can edit.
npx shadcn@latest add @reactframe/sankey-diagramOr copy the source by hand and install its dependencies:
npm install clsx tailwind-mergeProps
<SankeyDiagram /> accepts 8 props, all optional. It also accepts the usual <div> attributes, like className, style, id and aria-*, and passes them to its root element.
| Prop | Type | Default |
|---|---|---|
| theme | "dark" | "light" | "dark" |
| title | string | "Where visitors go" |
| subtitle | string | "Traffic source → first page → outcome, last 30 days" |
| nodes | { id: string; label: string; color?: string }[] | DEFAULT_NODES |
| links | { source: string; target: string; value: number }[] | DEFAULT_LINKS |
| height Height of the diagram, in px. | number | 340 |
| minWidth Below this container width the diagram keeps this width and scrolls sideways. | number | 620 |
| formatValue | (value: number) => string | (v) => v.toLocaleString("en-US") |
- theme"dark" | "light"Default: "dark"
- titlestringDefault: "Where visitors go"
- subtitlestringDefault: "Traffic source → first page → outcome, last 30 days"
- nodes{ id: string; label: string; color?: string }[]Default: DEFAULT_NODES
- links{ source: string; target: string; value: number }[]Default: DEFAULT_LINKS
- height
Height of the diagram, in px.
numberDefault: 340 - minWidth
Below this container width the diagram keeps this width and scrolls sideways.
numberDefault: 620 - formatValue(value: number) => stringDefault: (v) => v.toLocaleString("en-US")
npm dependencies
Installed for you by the shadcn CLI.
Sankey Diagram FAQ
- What data does it need?
- nodes is { id, label, color? }[] and links is { source, target, value }[], using node ids. Columns are worked out automatically from the links: a node sits one column after the furthest node that feeds it.
- How are nodes placed?
- Node heights follow the larger of their inflow and outflow. Each column starts centred, then a few passes nudge every node toward the weighted middle of the nodes it connects to, which cuts down crossing ribbons.
- What happens on phones?
- Labels need room on both sides, so below minWidth (620px by default) the diagram keeps that width and scrolls sideways inside the card.
- Is it accessible?
- The diagram is focusable with a text summary listing every flow; arrow keys step through nodes and ribbons with the tooltip, Escape clears. With reduced motion it appears without the left-to-right reveal.