Funnel Chart React component
A conversion funnel as one smooth flowing shape: each step's width follows its count, curving into the next, with step-to-step conversion pills on the joins, ghost bands that show how much was lost, a drop-off tooltip and a stacked-rows layout on phones.
About the Funnel Chart component
Funnel Chart shows how many people make it through each step of a flow, from first visit to paying customer, as one smooth shape that narrows as people drop off. Each join carries the step-to-step conversion rate, and a faint full-height band behind every step shows what was lost.
Hover or tap a step for its count, its conversion from the step before and how many dropped off. On phones it turns into a clean list of steps with progress bars.
When to use it
Use it for signup and onboarding flows, checkout funnels, sales pipelines (lead → qualified → won), hiring pipelines and feature adoption.
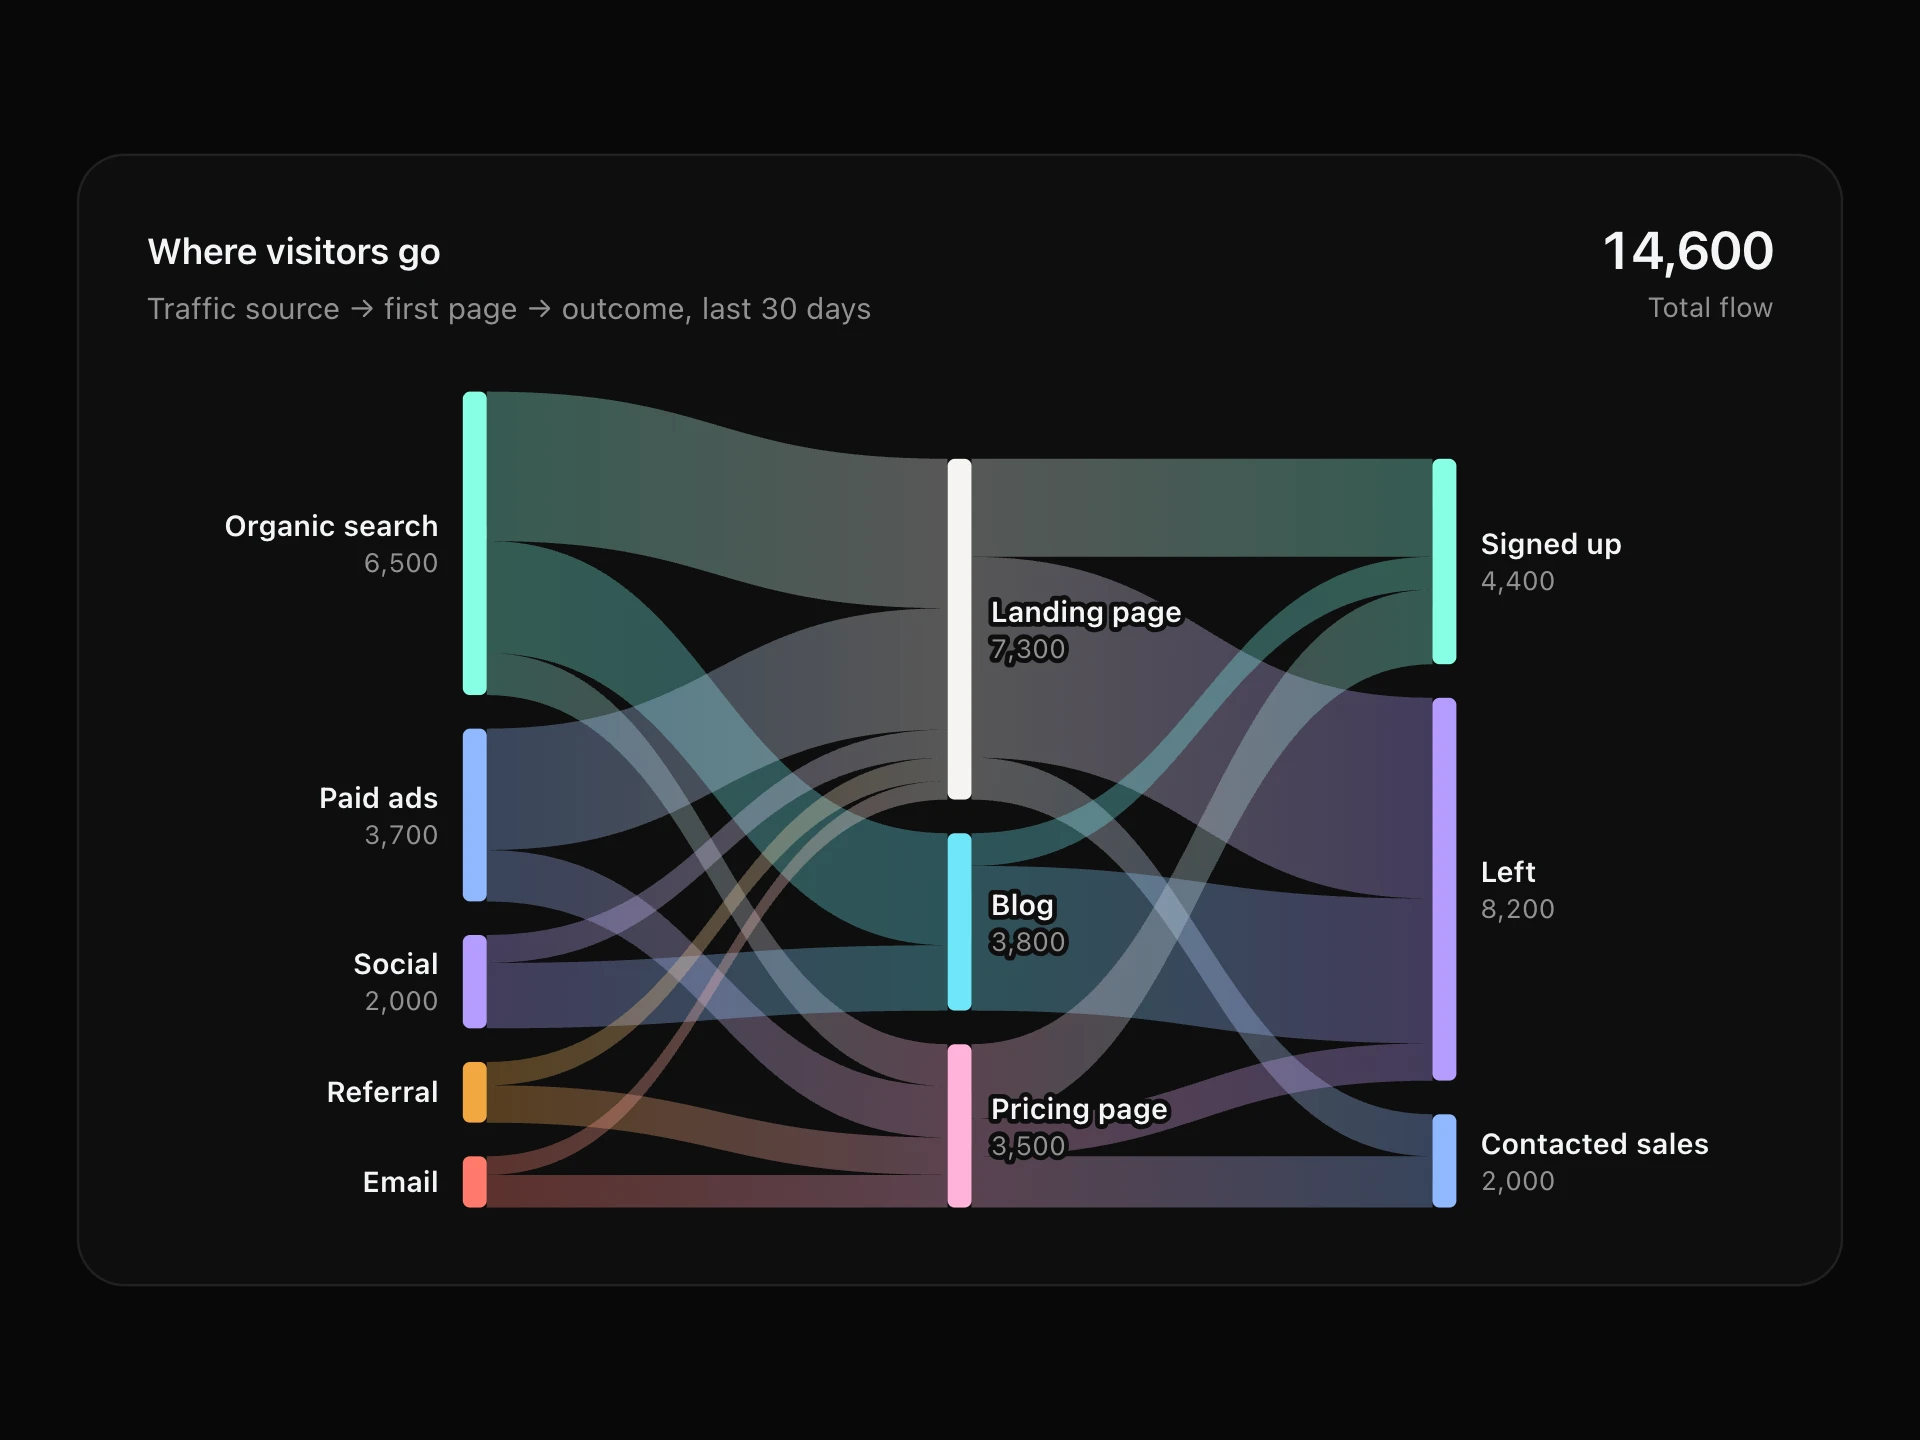
It works best with 3–6 steps that every user passes through in order; for flows that branch, use a Sankey diagram.
Installation
Add the Funnel Chart component to your project with the shadcn CLI. It lands in components/funnel-chart.tsx as plain React + Tailwind CSS source you own and can edit.
npx shadcn@latest add @reactframe/funnel-chartOr copy the source by hand and install its dependencies:
npm install clsx tailwind-mergeProps
<FunnelChart /> accepts 7 props, all optional. It also accepts the usual <div> attributes, like className, style, id and aria-*, and passes them to its root element.
| Prop | Type | Default |
|---|---|---|
| theme | "dark" | "light" | "dark" |
| title | string | "Signup funnel" |
| subtitle | string | "Last 30 days, all channels" |
| stages | { label: string; value: number }[] | DEFAULT_STAGES |
| colors Colours at the wide and narrow ends of the funnel. | [string, string] | — |
| height Height of the funnel, in px. | number | 260 |
| formatValue | (value: number) => string | (v) => v.toLocaleString("en-US") |
- theme"dark" | "light"Default: "dark"
- titlestringDefault: "Signup funnel"
- subtitlestringDefault: "Last 30 days, all channels"
- stages{ label: string; value: number }[]Default: DEFAULT_STAGES
- colors
Colours at the wide and narrow ends of the funnel.
[string, string] - height
Height of the funnel, in px.
numberDefault: 260 - formatValue(value: number) => stringDefault: (v) => v.toLocaleString("en-US")
npm dependencies
Installed for you by the shadcn CLI.
Funnel Chart FAQ
- How do I pass my steps?
- stages is { label, value }[] in order, widest first. Heights are relative to the first step, and the pills show each step's value divided by the step before.
- Can I change the colours?
- colors takes the colours for the wide and narrow ends; the funnel blends between them. formatValue formats the counts (default: 12,384).
- What happens on small screens?
- Under 560px wide it switches to a list: one row per step with a progress bar, its share of the first step and the conversion and drop-off to the next.
- Is it accessible?
- The chart is focusable with a summary of every step and the overall conversion; arrow keys move between steps and Escape clears. With reduced motion the funnel appears without growing.