Scatter Plot React component
A scatter plot for spotting relationships: coloured groups of points that pop in on scroll, a least-squares trend line with its slope and R², legend toggles, and a nearest-point tooltip with guide lines and value pills on both axes.
About the Scatter Plot component
Scatter Plot puts every item on two measures at once, so you can see whether they move together, where the clusters are and which items are outliers. Points are coloured by group, and a trend line with its slope and R² tells you how strong the relationship is.
Hover, tap or use the arrow keys to read a point: guide lines run to both axes with value pills, and a tooltip names it. Click the legend to hide a group; the trend line refits to what's left.
When to use it
Use it for campaigns (spend vs results), products (price vs rating), accounts (seats vs usage), experiments, or any time the question is 'does more of this mean more of that?'.
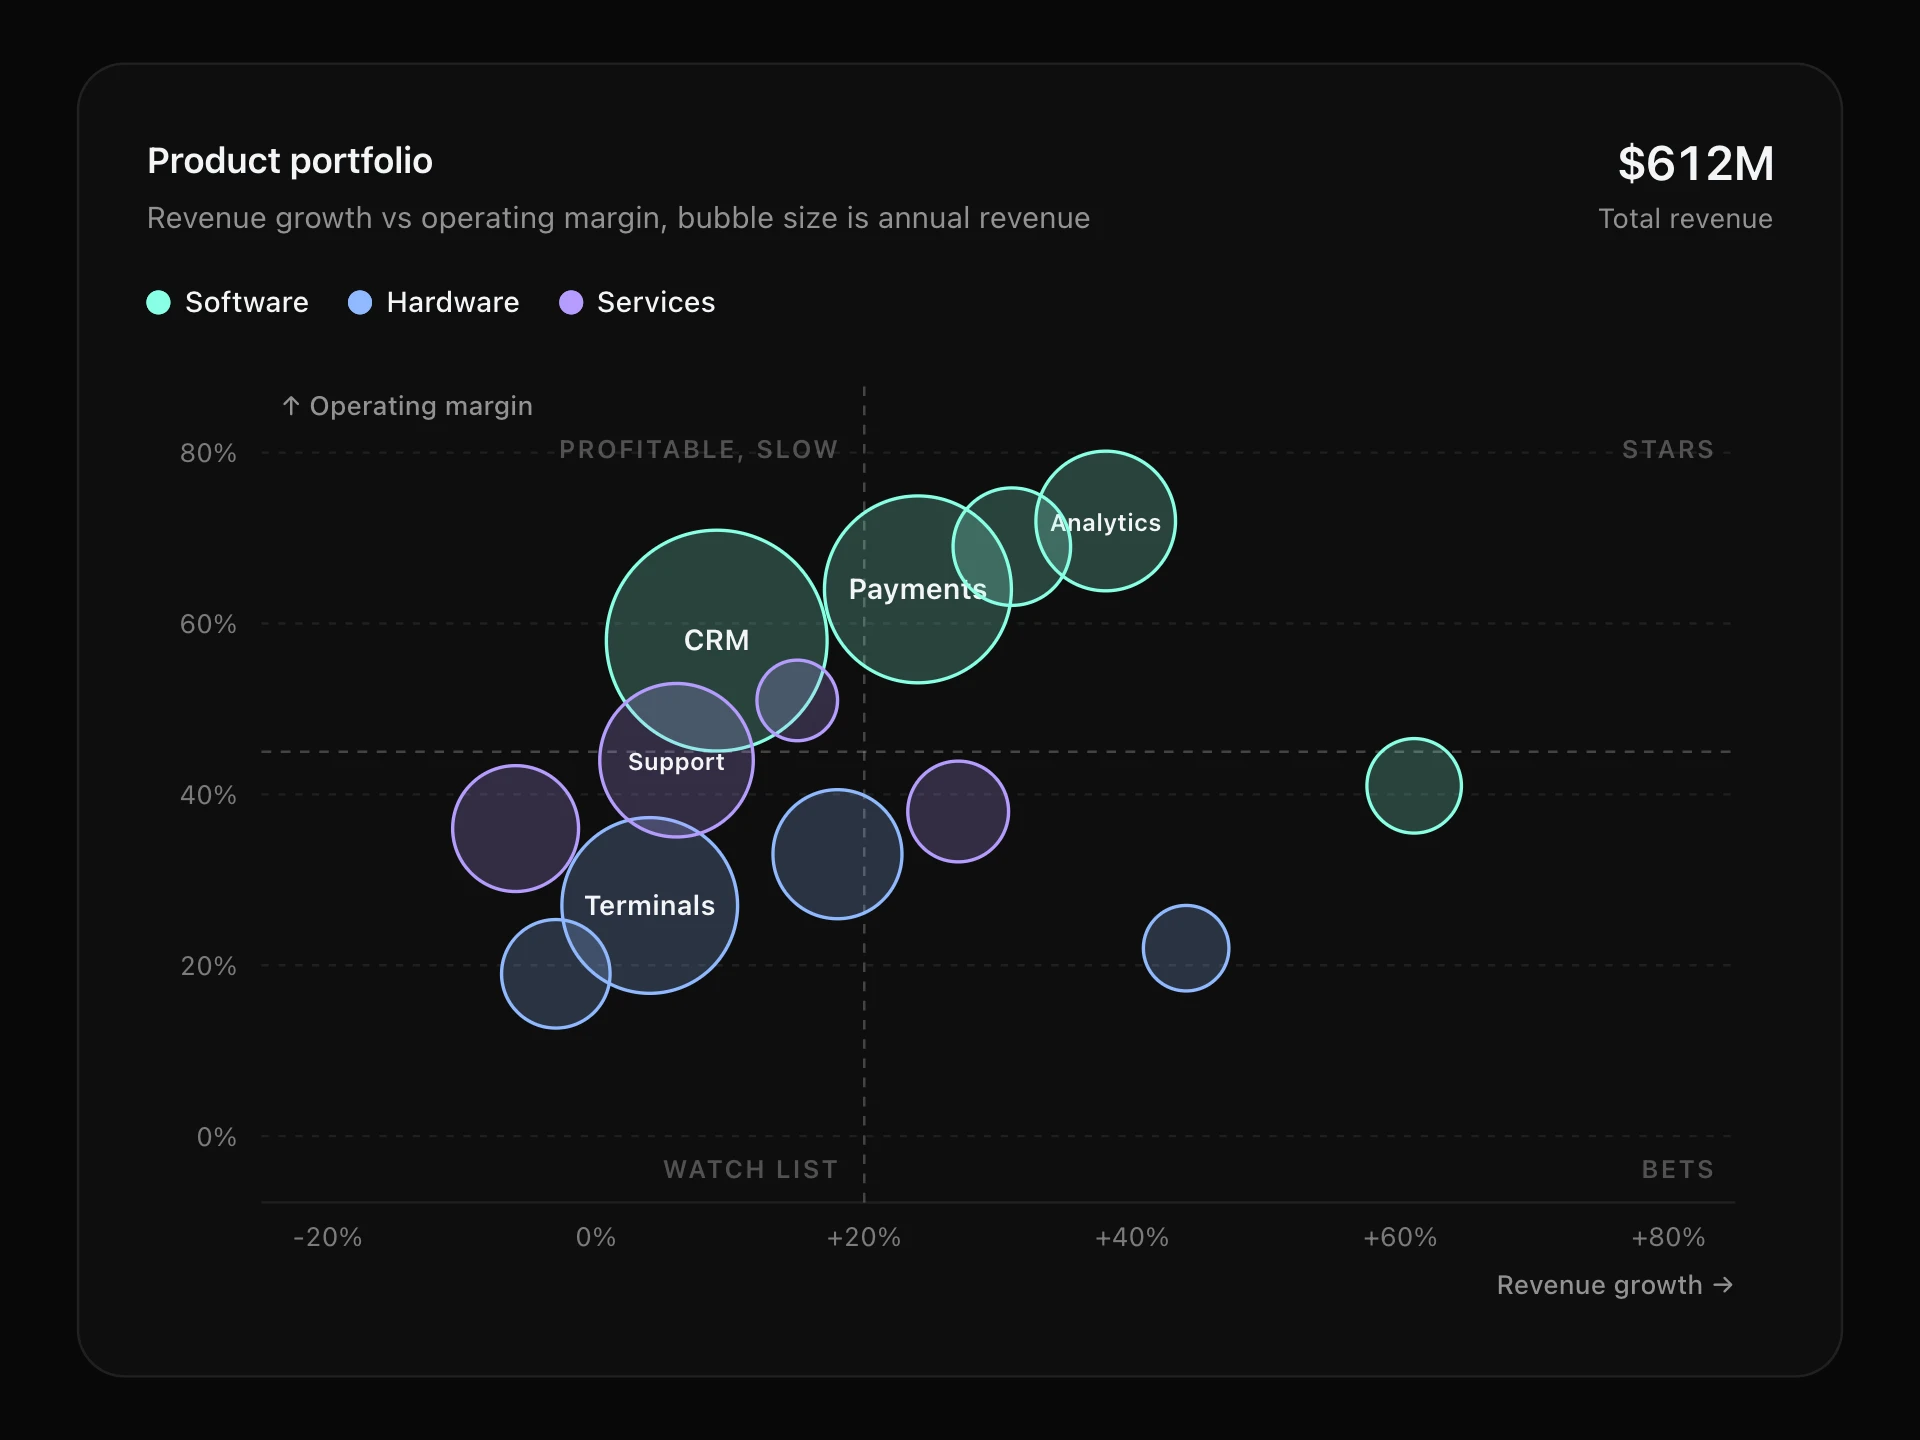
For a third measure, use a bubble chart; for change over time, a line chart reads better.
Installation
Add the Scatter Plot component to your project with the shadcn CLI. It lands in components/scatter-plot.tsx as plain React + Tailwind CSS source you own and can edit.
npx shadcn@latest add @reactframe/scatter-plotOr copy the source by hand and install its dependencies:
npm install clsx tailwind-mergeProps
<ScatterPlot /> accepts 11 props, all optional. It also accepts the usual <div> attributes, like className, style, id and aria-*, and passes them to its root element.
| Prop | Type | Default |
|---|---|---|
| theme | "dark" | "light" | "dark" |
| title | string | "Ad spend vs signups" |
| subtitle | string | "Each dot is one campaign, last two quarters" |
| groups | { label: string; color?: string }[] | DEFAULT_GROUPS |
| points | { x: number; y: number; group: number; label?: string }[] | DEFAULT_POINTS |
| xLabel | string | "Ad spend ($K)" |
| yLabel | string | "Signups" |
| showTrend Draw a least-squares trend line through the visible points. | boolean | true |
| height Height of the plot area, in px. | number | 320 |
| formatX | (value: number) => string | (v) => `$${v.toLocaleString("en-US", { maximumFractionDigits: 1 })}K` |
| formatY | (value: number) => string | (v) => v.toLocaleString("en-US", { maximumFractionDigits: 0 }) |
- theme"dark" | "light"Default: "dark"
- titlestringDefault: "Ad spend vs signups"
- subtitlestringDefault: "Each dot is one campaign, last two quarters"
- groups{ label: string; color?: string }[]Default: DEFAULT_GROUPS
- points{ x: number; y: number; group: number; label?: string }[]Default: DEFAULT_POINTS
- xLabelstringDefault: "Ad spend ($K)"
- yLabelstringDefault: "Signups"
- showTrend
Draw a least-squares trend line through the visible points.
booleanDefault: true - height
Height of the plot area, in px.
numberDefault: 320 - formatX(value: number) => stringDefault: (v) => `$${v.toLocaleString("en-US", { maximumFractionDigits: 1 })}K`
- formatY(value: number) => stringDefault: (v) => v.toLocaleString("en-US", { maximumFractionDigits: 0 })
npm dependencies
Installed for you by the shadcn CLI.
Scatter Plot FAQ
- How do I pass my data?
- groups lists the colour groups and points is { x, y, group, label? }, where group is an index into groups. label is optional and shows in the tooltip.
- What does the number in the header mean?
- It's the slope of the least-squares trend line: how much y goes up for each unit of x, for the visible points. R² (0 to 1) says how well the line fits. Set showTrend={false} to hide both.
- Can I format the axes?
- formatX and formatY format the ticks, the axis pills and the tooltip; xLabel and yLabel name the axes.
- Is it accessible?
- The plot is focusable with a text summary of the trend; arrow keys step through points in x order and Escape clears. With reduced motion the points appear without popping in.