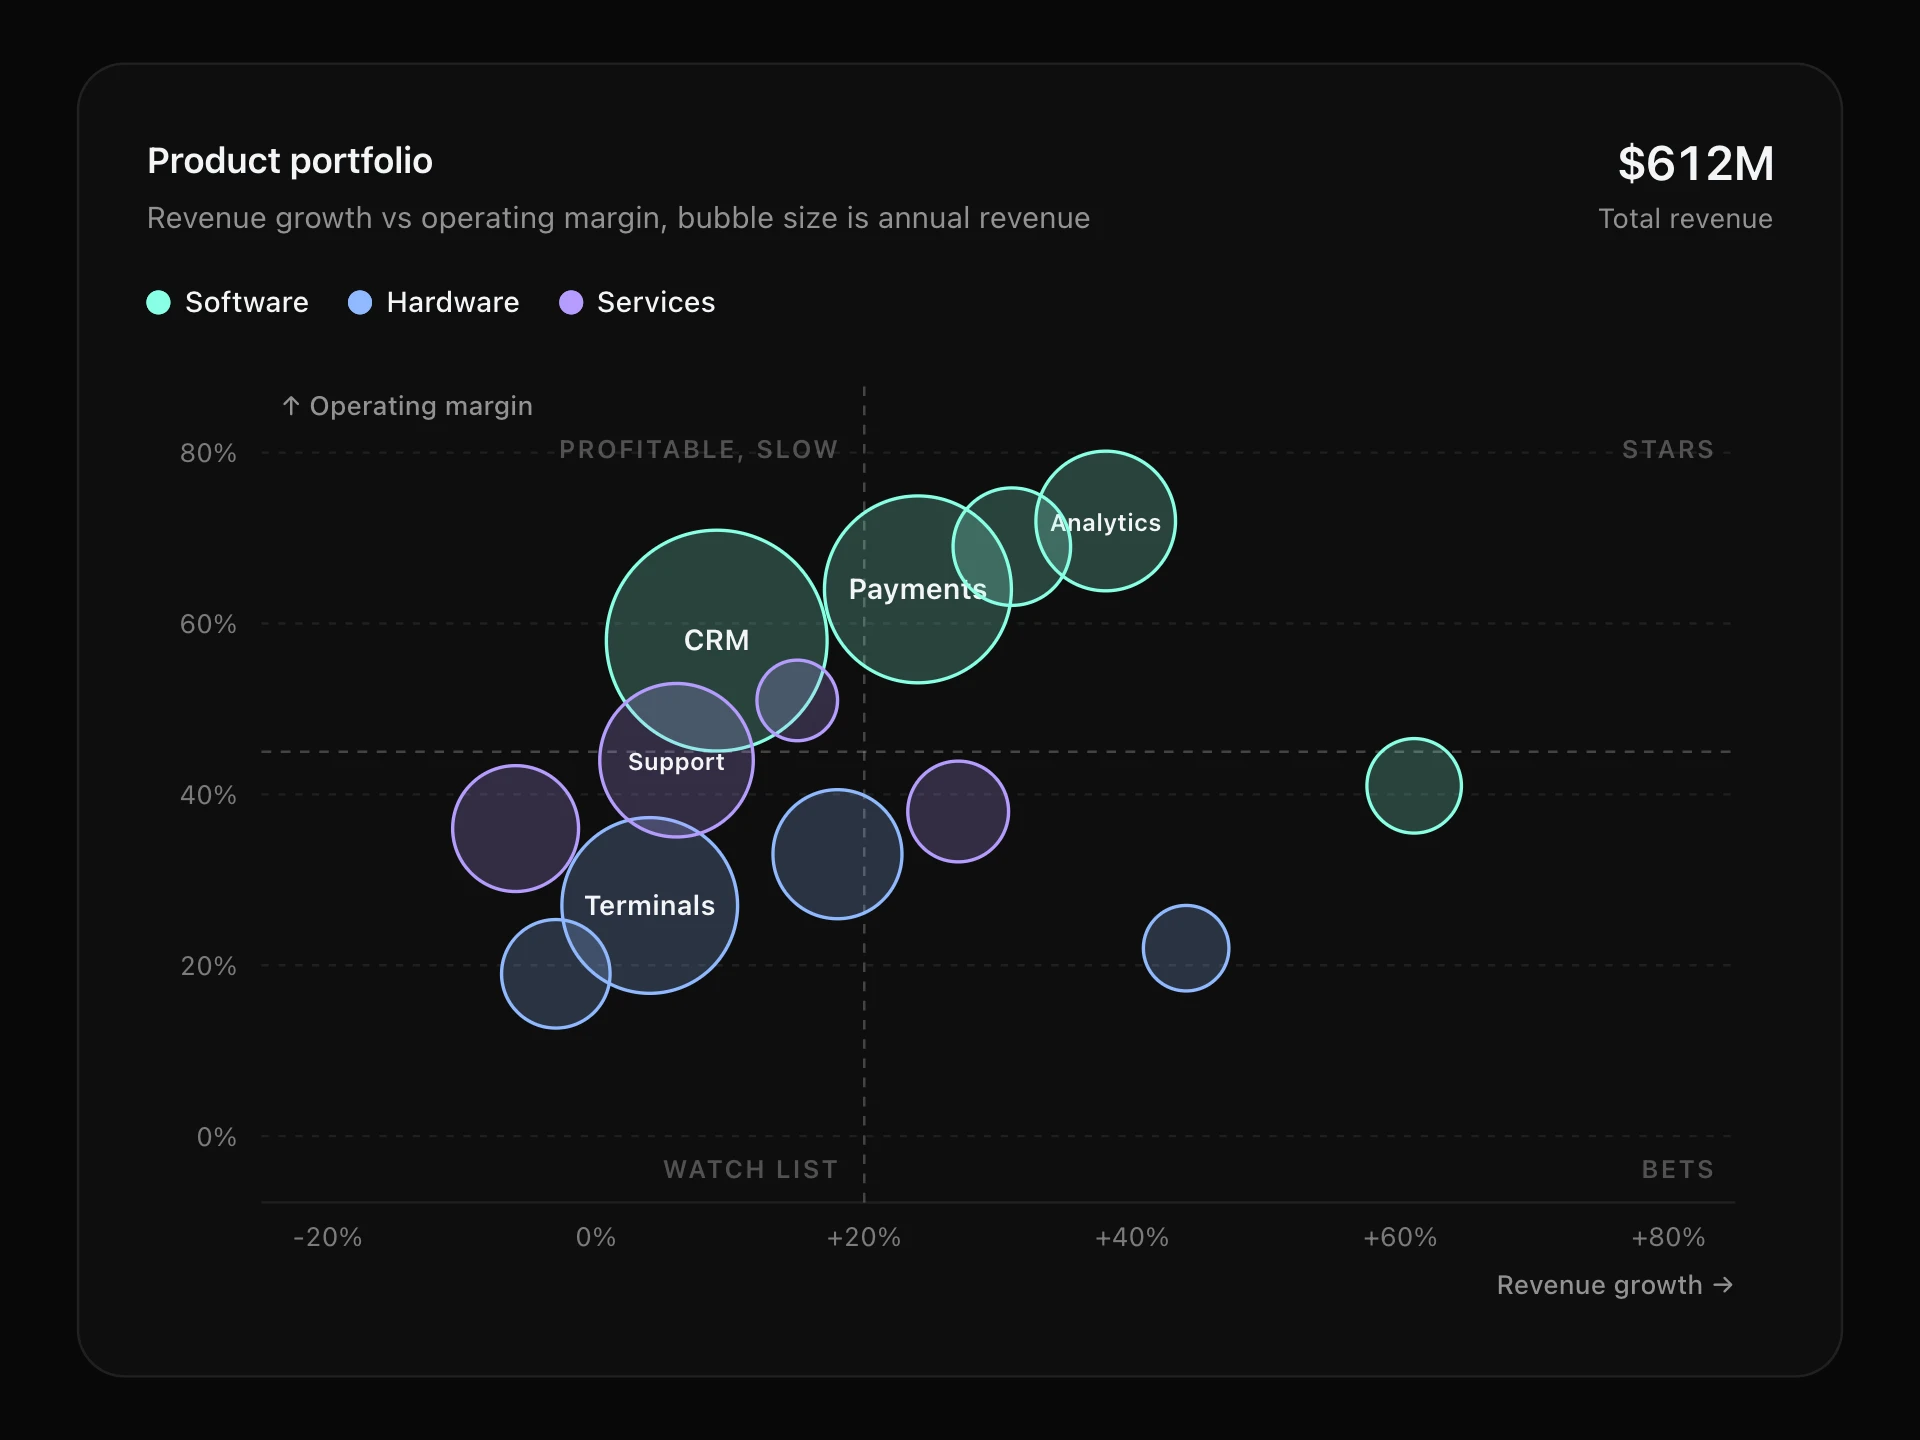
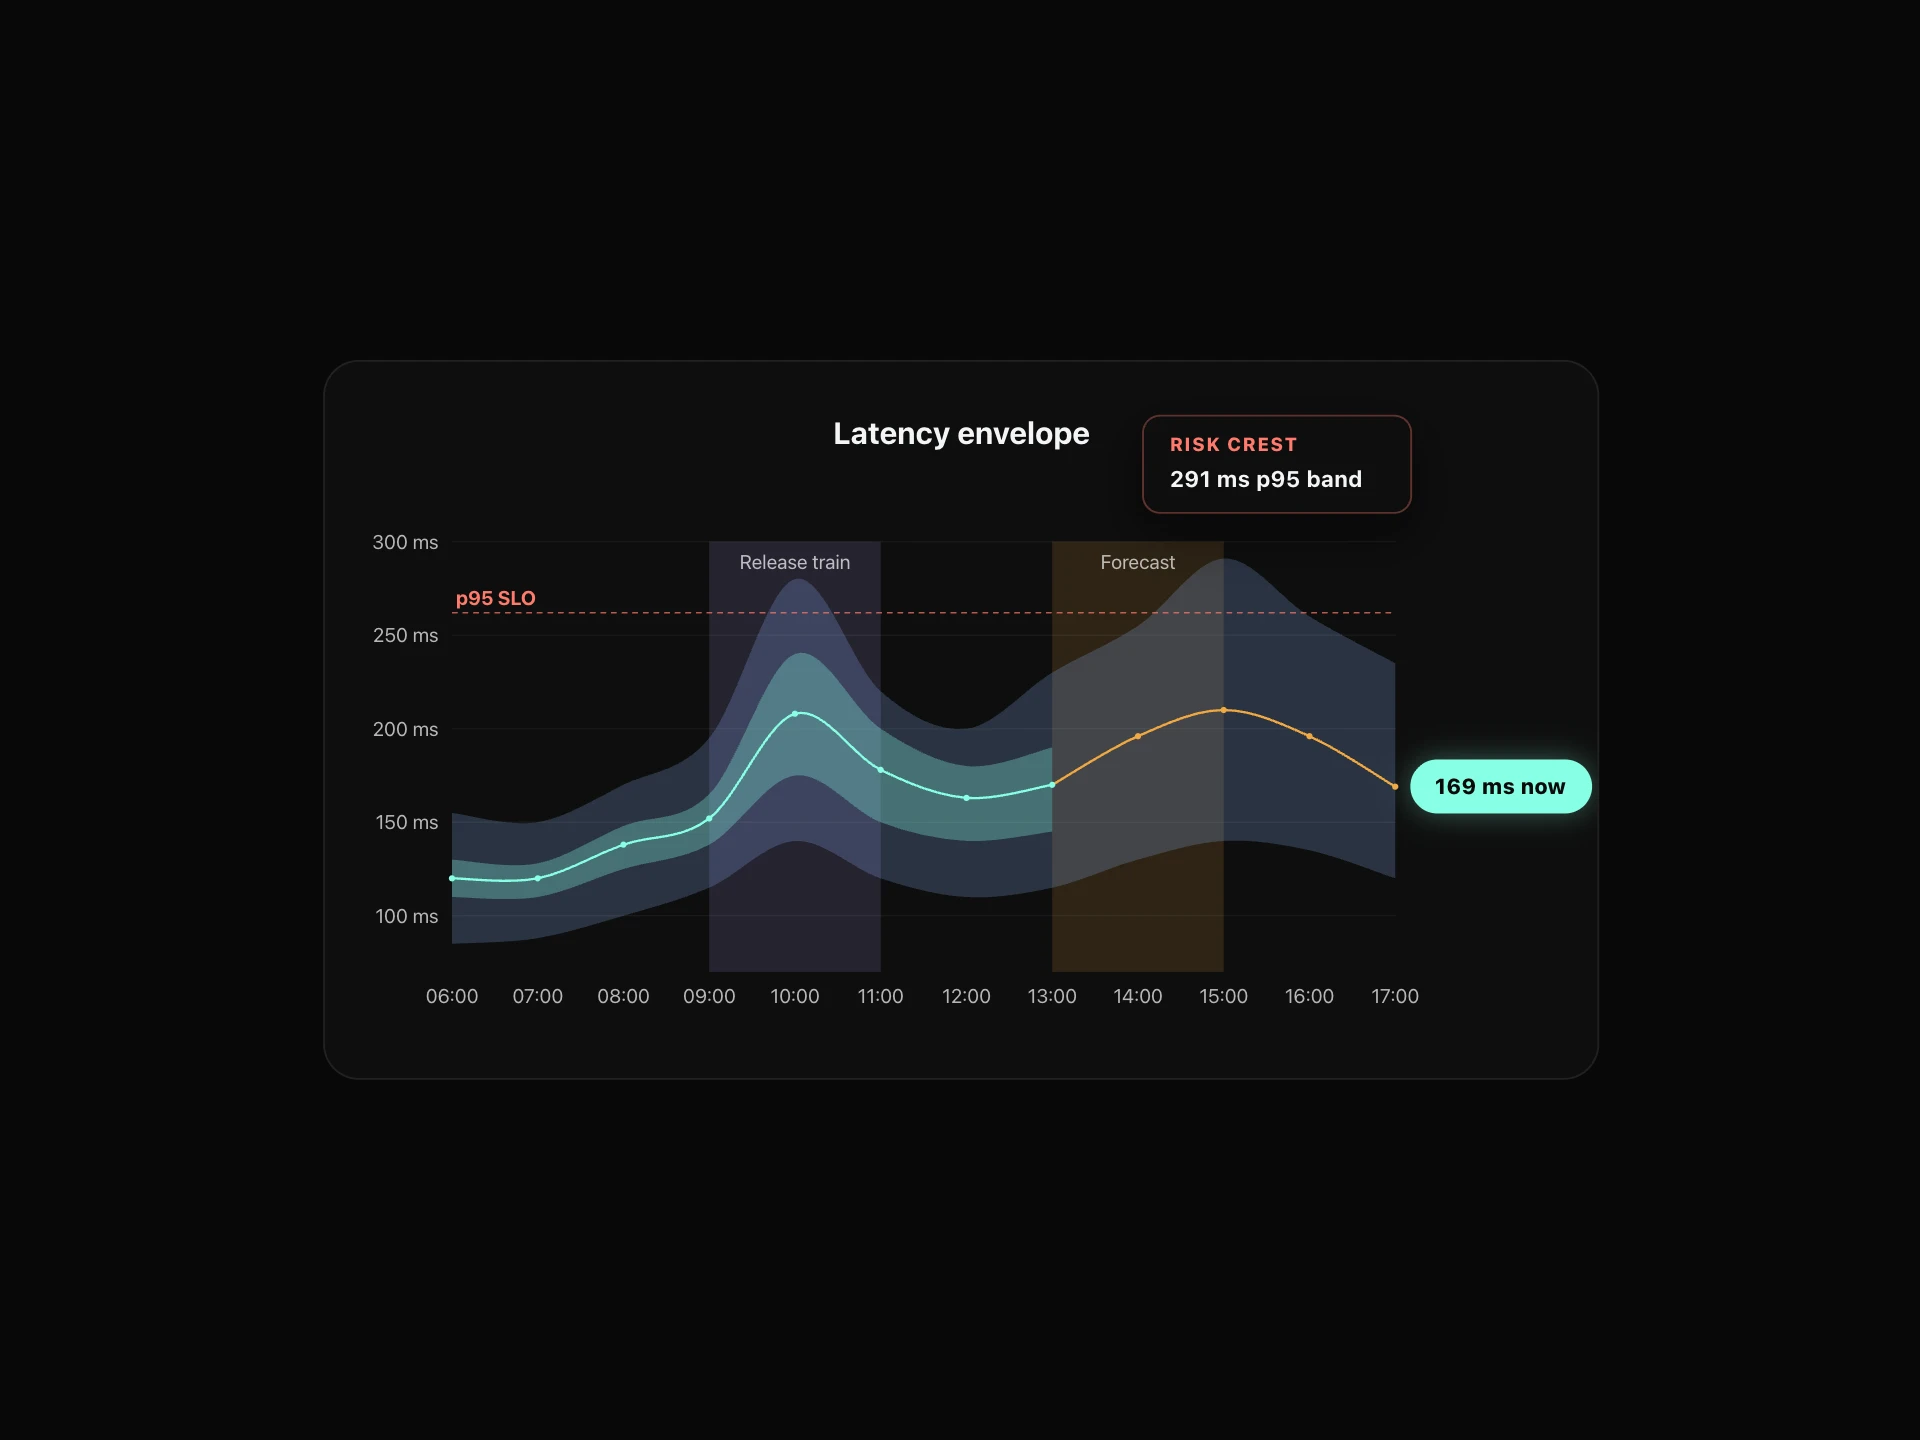
Stacked Area Chart React component
A stacked area chart for totals and their parts: smooth layered areas that draw in on scroll, a Total / Share switch for a 100% view, legend toggles that reflow the stack, and a crosshair tooltip with every series and the total.
About the Stacked Area Chart component
Stacked Area Chart shows a total over time and the parts that make it up, as smooth bands layered on top of each other. It's the chart for questions like 'how is traffic growing, and which channel is driving it?'.
Switch to Share to see each part as a percentage of 100, click the legend to hide a series (the stack reflows smoothly) and hover or use the arrow keys to read every value at a point, with the total.
When to use it
Use it for traffic by channel, revenue by product, users by plan, storage by type: any total that breaks down into a few parts over time.
Keep it to five or six series; beyond that the thin bands at the top get hard to read. For parts that don't add up to a meaningful total, use a line chart instead.
Installation
Add the Stacked Area Chart component to your project with the shadcn CLI. It lands in components/stacked-area-chart.tsx as plain React + Tailwind CSS source you own and can edit.
npx shadcn@latest add @reactframe/stacked-area-chartOr copy the source by hand and install its dependencies:
npm install clsx tailwind-mergeProps
<StackedAreaChart /> accepts 10 props, all optional. It also accepts the usual <div> attributes, like className, style, id and aria-*, and passes them to its root element.
| Prop | Type | Default |
|---|---|---|
| theme | "dark" | "light" | "dark" |
| title | string | "Visitors by channel" |
| subtitle | string | "Monthly unique visitors, 2025" |
| series | { label: string; color?: string }[] | DEFAULT_SERIES |
| data | { label: string; values: number[] }[] | DEFAULT_DATA |
| mode "stacked" shows totals; "percent" shows each series' share of 100%. | "stacked" | "percent" | "stacked" |
| showModeSwitch Show the Total / Share switch in the header. | boolean | true |
| height Height of the plot area, in px. | number | 300 |
| curved Smooth curves instead of straight segments. | boolean | true |
| formatValue | (value: number) => string | (v) => compact.format(v) |
- theme"dark" | "light"Default: "dark"
- titlestringDefault: "Visitors by channel"
- subtitlestringDefault: "Monthly unique visitors, 2025"
- series{ label: string; color?: string }[]Default: DEFAULT_SERIES
- data{ label: string; values: number[] }[]Default: DEFAULT_DATA
- mode
"stacked" shows totals; "percent" shows each series' share of 100%.
"stacked" | "percent"Default: "stacked" - showModeSwitch
Show the Total / Share switch in the header.
booleanDefault: true - height
Height of the plot area, in px.
numberDefault: 300 - curved
Smooth curves instead of straight segments.
booleanDefault: true - formatValue(value: number) => stringDefault: (v) => compact.format(v)
npm dependencies
Installed for you by the shadcn CLI.
Stacked Area Chart FAQ
- How do I pass my data?
- series lists the bands from bottom to top ({ label, color? }) and data has one entry per x position: { label, values }, with one value per series in the same order.
- What does the Share switch do?
- It normalises every point to 100%, so you see how the mix changes rather than how the total grows. Set mode="percent" to start there, or showModeSwitch={false} to hide the switch.
- Can I format the numbers?
- Pass formatValue, for example (v) => `$${v.toLocaleString()}`. It's used on the axis, the header and the tooltip; the default is compact (12.4K).
- Is it accessible?
- The plot is focusable with a text summary, arrow keys move the crosshair, Escape clears it, and the legend items are real toggle buttons. With reduced motion the chart appears without the draw-in.