Line Chart React component
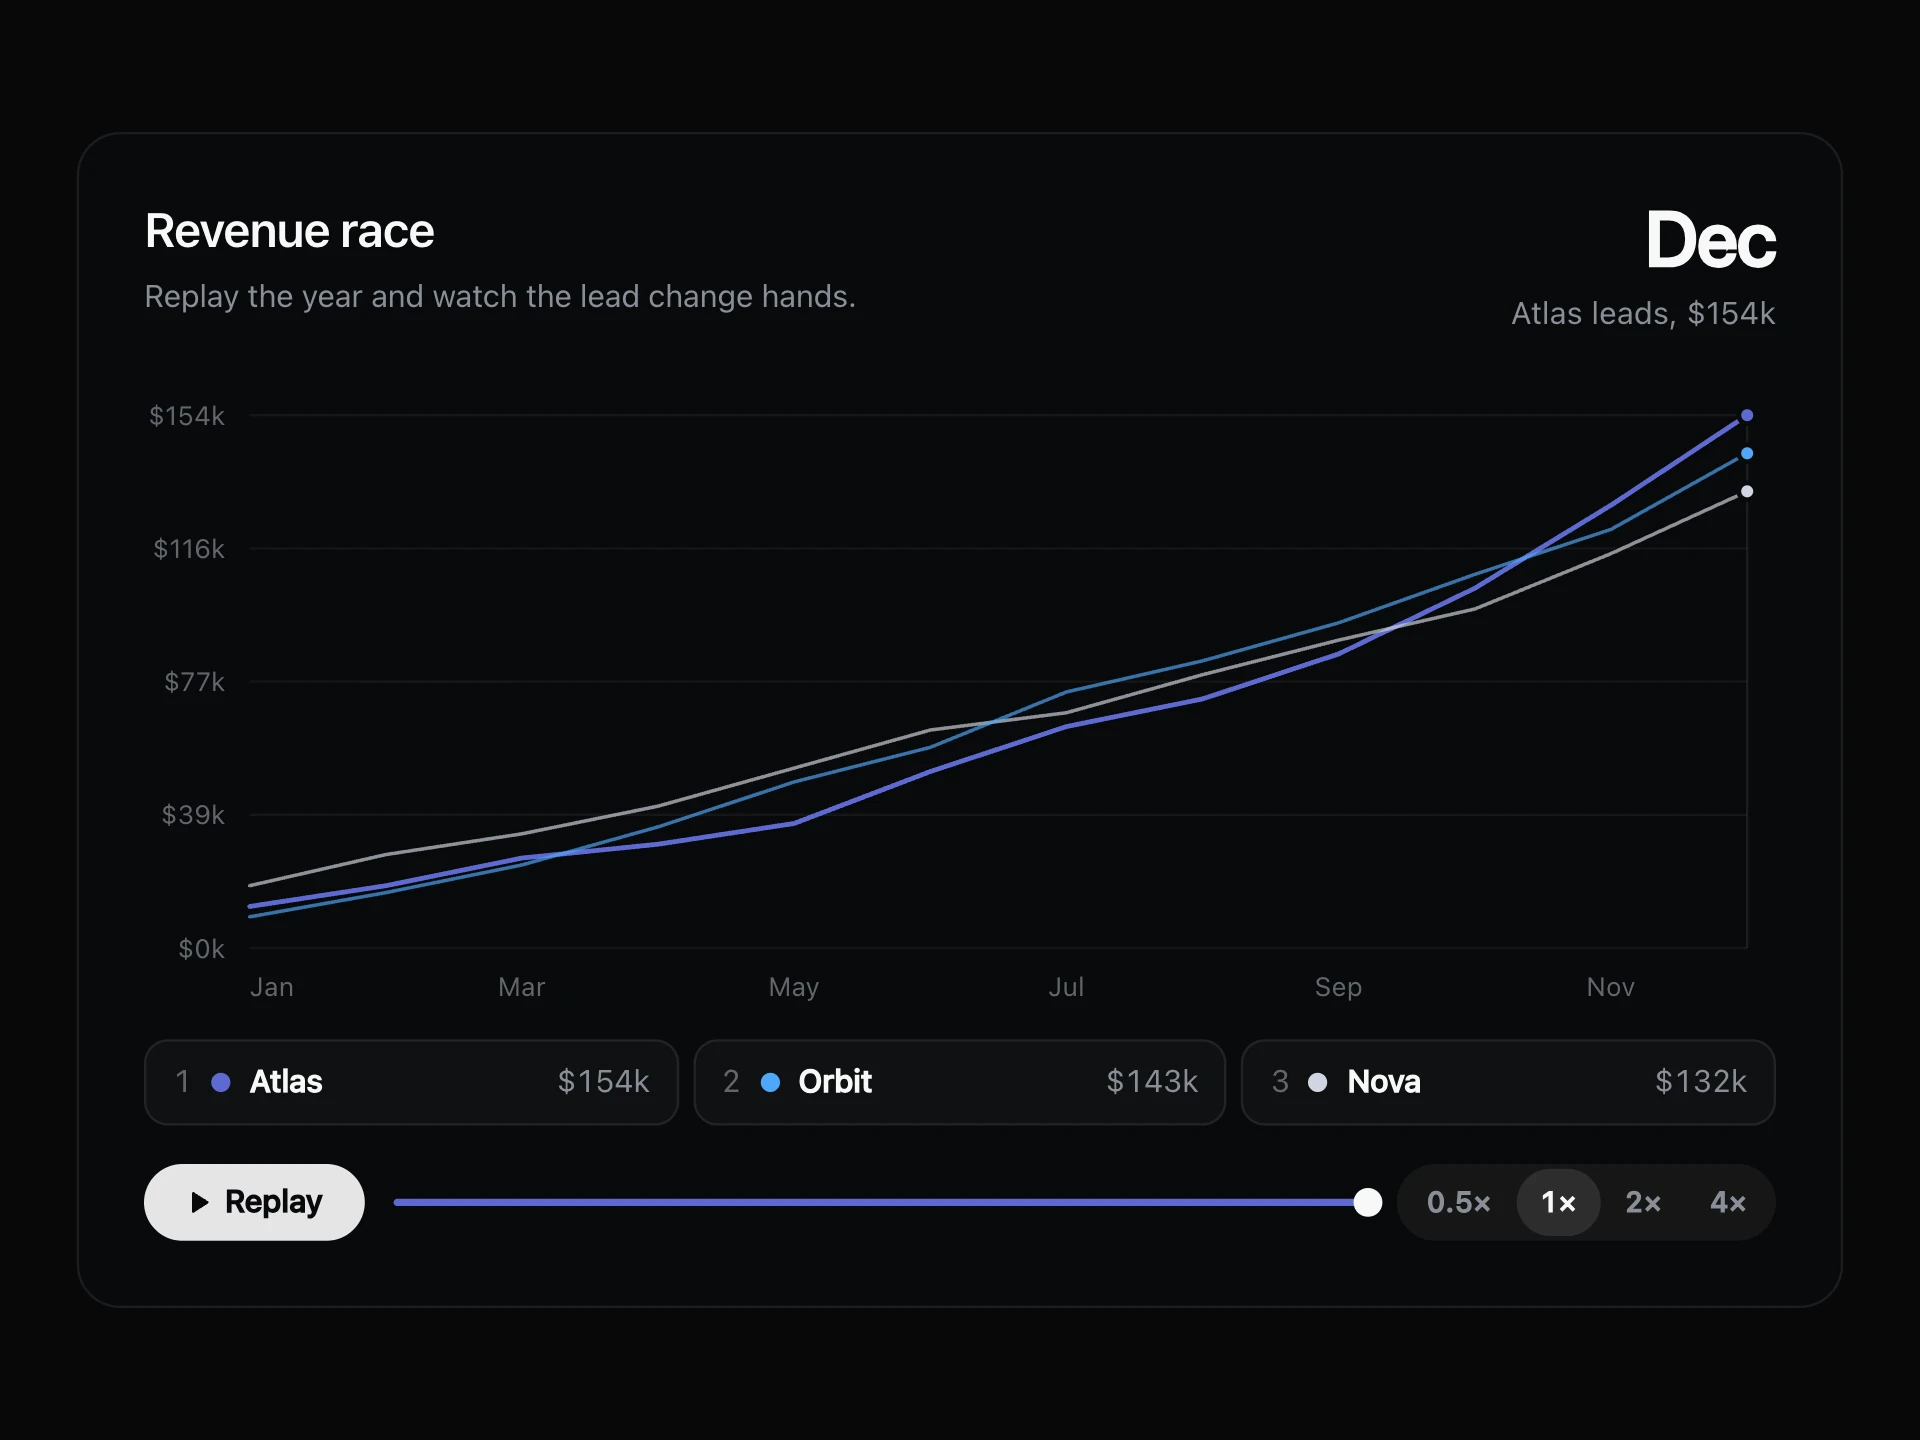
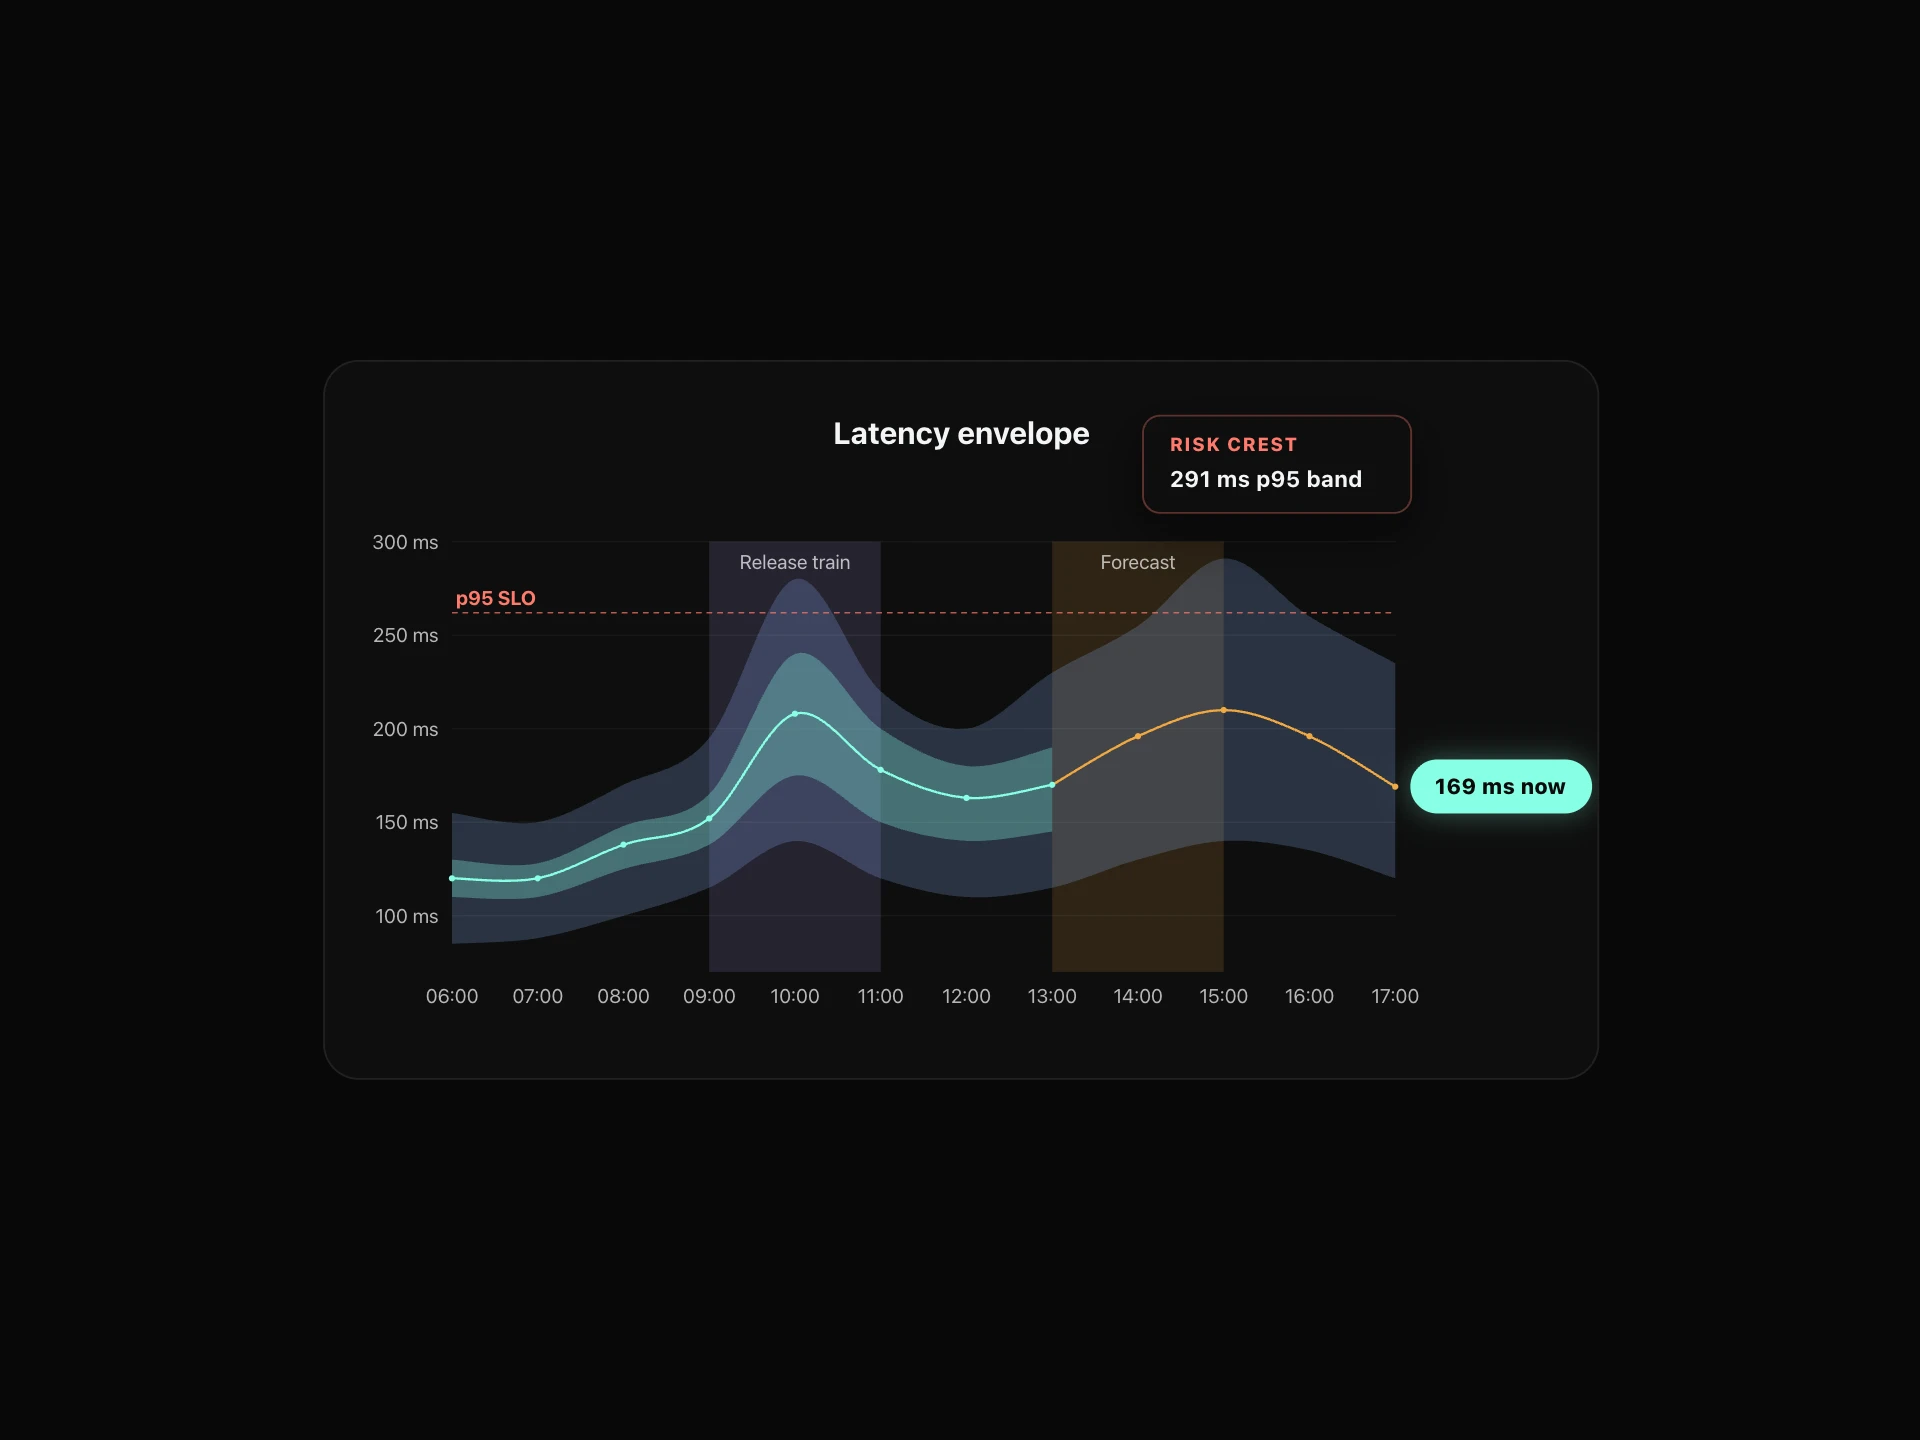
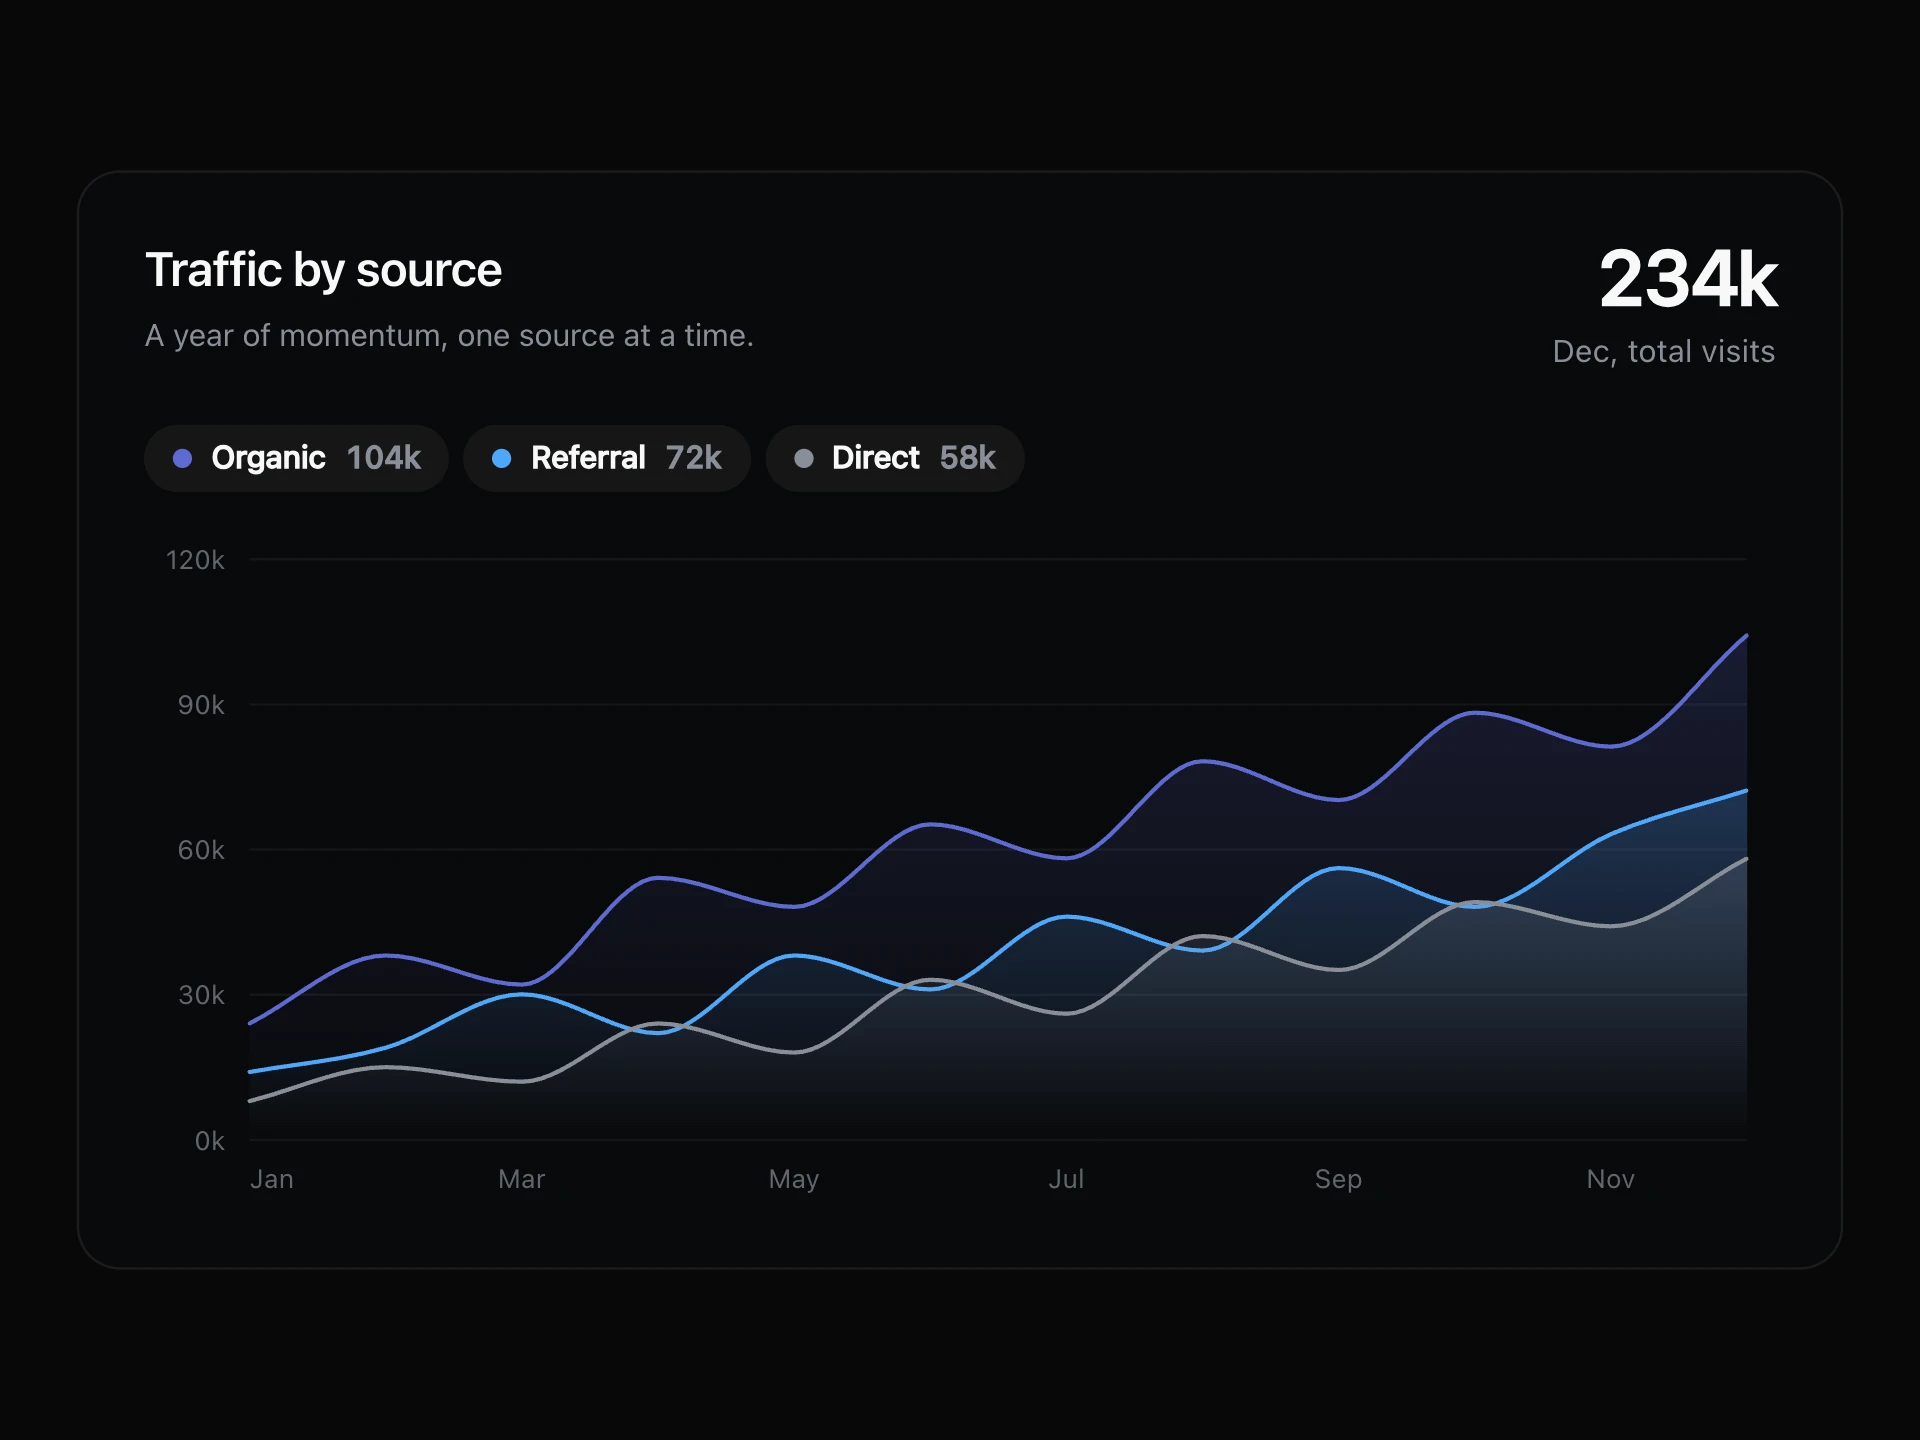
A multi-series line/area chart, smooth Catmull-Rom curves, a highlighted zone band, a reference line, endpoint value badges, and a hover crosshair with per-series tooltips.
About the Line Chart component
Line Chart is a free multi-series line chart drawn as a self-contained SVG, with no charting library (its only dependencies are clsx and tailwind-merge). It plots up to four smoothed series, each with an optional gradient area, shades a highlighted zone and draws a dashed reference line. A badge at the right edge labels each series' last value, and hovering shows a crosshair, the point's date and every series' value.
Data is dataPoints, an array of { x, date, v1, v2, v3, v4 }: x is the axis label, date is the hover caption and v1 to v4 map to series1 to series4. Each series takes label, color, style (solid, dashed or dotted), area, showBadge and visible. The axis uses yMin, yMax and yStep, and zone, referenceLine, startLabel and markerIndices add the annotations. theme switches between light and dark colors, and on narrow containers the chart gets shorter so its text isn't squashed.
When to use it
Use it for metric trends over time, such as revenue, activation, retention or latency, comparing a few series on a dashboard or report page.
For a single small trend inside a card, use Sparkline Stat. For per-period totals split into parts, use Bar Chart.
Installation
Add the Line Chart component to your project with the shadcn CLI. It lands in components/line-chart.tsx as plain React + Tailwind CSS source you own and can edit.
npx shadcn@latest add @reactframe/line-chartOr copy the source by hand and install its dependencies:
npm install clsx tailwind-mergeProps
<LineChart /> accepts 19 props (required ones are marked *).
| Prop | Type | Default |
|---|---|---|
| theme | "light" | "dark" | "dark" |
| title | string | "Release-room health index" |
| subtitle | string | "" |
| chartHeight | number | 420 |
| showLegend | boolean | true |
| yMin | number | 50 |
| yMax | number | 350 |
| yStep | number | 50 |
| series1 | object | theme === "light" ? LIGHT_SERIES1 : DARK_SERIES1 |
| series1.visible | boolean | — |
| series1.label* | string | — |
| series1.color* | string | — |
- theme"light" | "dark"Default: "dark"
- titlestringDefault: "Release-room health index"
- subtitlestringDefault: ""
- chartHeightnumberDefault: 420
- showLegendbooleanDefault: true
- yMinnumberDefault: 50
- yMaxnumberDefault: 350
- yStepnumberDefault: 50
- series1objectDefault: theme === "light" ? LIGHT_SERIES1 : DARK_SERIES1
- series1.visibleboolean
- series1.label*string
- series1.color*string
Show all 52 propsShow fewer
| series1.style | "solid" | "dashed" | "dotted" | — |
| series1.area | boolean | — |
| series1.showBadge | boolean | — |
| series2 | object | theme === "light" ? LIGHT_SERIES2 : DARK_SERIES2 |
| series2.visible | boolean | — |
| series2.label* | string | — |
| series2.color* | string | — |
| series2.style | "solid" | "dashed" | "dotted" | — |
| series2.area | boolean | — |
| series2.showBadge | boolean | — |
| series3 | object | theme === "light" ? LIGHT_SERIES3 : DARK_SERIES3 |
| series3.visible | boolean | — |
| series3.label* | string | — |
| series3.color* | string | — |
| series3.style | "solid" | "dashed" | "dotted" | — |
| series3.area | boolean | — |
| series3.showBadge | boolean | — |
| series4 | object | theme === "light" ? LIGHT_SERIES4 : DARK_SERIES4 |
| series4.visible | boolean | — |
| series4.label* | string | — |
| series4.color* | string | — |
| series4.style | "solid" | "dashed" | "dotted" | — |
| series4.area | boolean | — |
| series4.showBadge | boolean | — |
| dataPoints | { x: string; date: string; v1: number; v2: number; v3: number; v4: number }[] | DEFAULT_DATA |
| zone | object | DEFAULT_ZONE |
| zone.visible | boolean | — |
| zone.label* | string | — |
| zone.startIndex* | number | — |
| zone.endIndex* | number | — |
| referenceLine | object | DEFAULT_REF_LINE |
| referenceLine.visible | boolean | — |
| referenceLine.value* | number | — |
| referenceLine.label* | string | — |
| startLabel | object | DEFAULT_START_LABEL |
| startLabel.visible | boolean | — |
| startLabel.text* | string | — |
| markerIndices | number[] | DEFAULT_MARKER_INDICES |
| enableHover | boolean | true |
| className | string | — |
- series1.style"solid" | "dashed" | "dotted"
- series1.areaboolean
- series1.showBadgeboolean
- series2objectDefault: theme === "light" ? LIGHT_SERIES2 : DARK_SERIES2
- series2.visibleboolean
- series2.label*string
- series2.color*string
- series2.style"solid" | "dashed" | "dotted"
- series2.areaboolean
- series2.showBadgeboolean
- series3objectDefault: theme === "light" ? LIGHT_SERIES3 : DARK_SERIES3
- series3.visibleboolean
- series3.label*string
- series3.color*string
- series3.style"solid" | "dashed" | "dotted"
- series3.areaboolean
- series3.showBadgeboolean
- series4objectDefault: theme === "light" ? LIGHT_SERIES4 : DARK_SERIES4
- series4.visibleboolean
- series4.label*string
- series4.color*string
- series4.style"solid" | "dashed" | "dotted"
- series4.areaboolean
- series4.showBadgeboolean
- dataPoints{ x: string; date: string; v1: number; v2: number; v3: number; v4: number }[]Default: DEFAULT_DATA
- zoneobjectDefault: DEFAULT_ZONE
- zone.visibleboolean
- zone.label*string
- zone.startIndex*number
- zone.endIndex*number
- referenceLineobjectDefault: DEFAULT_REF_LINE
- referenceLine.visibleboolean
- referenceLine.value*number
- referenceLine.label*string
- startLabelobjectDefault: DEFAULT_START_LABEL
- startLabel.visibleboolean
- startLabel.text*string
- markerIndicesnumber[]Default: DEFAULT_MARKER_INDICES
- enableHoverbooleanDefault: true
- classNamestring
Kits
Sets of components designed to be used together on one site, Line Chart included.
Collections
Use-case pages that compare Line Chart with the other components that do a similar job.
npm dependencies
Installed for you by the shadcn CLI.
Line Chart FAQ
- Can I show more than four lines?
- No. The data shape has four value keys (v1 to v4) tied to series1 to series4. Hide the ones you don't need with visible: false.
- What happens to values outside yMin and yMax?
- They are clamped to the edge of the plot, so set the range to cover your data. The defaults are 50 to 350 with a step of 50.
- Where do the markers go?
- markerIndices lists the data indices that get a ringed dot, on series1 only. The default is [3, 5, 7].
- Can keyboard and screen-reader users read it?
- Not from the chart itself: hover responds only to the mouse, and the SVG has no ARIA labels. Put the key numbers in text or a table next to it.