Aurora Area Chart React component
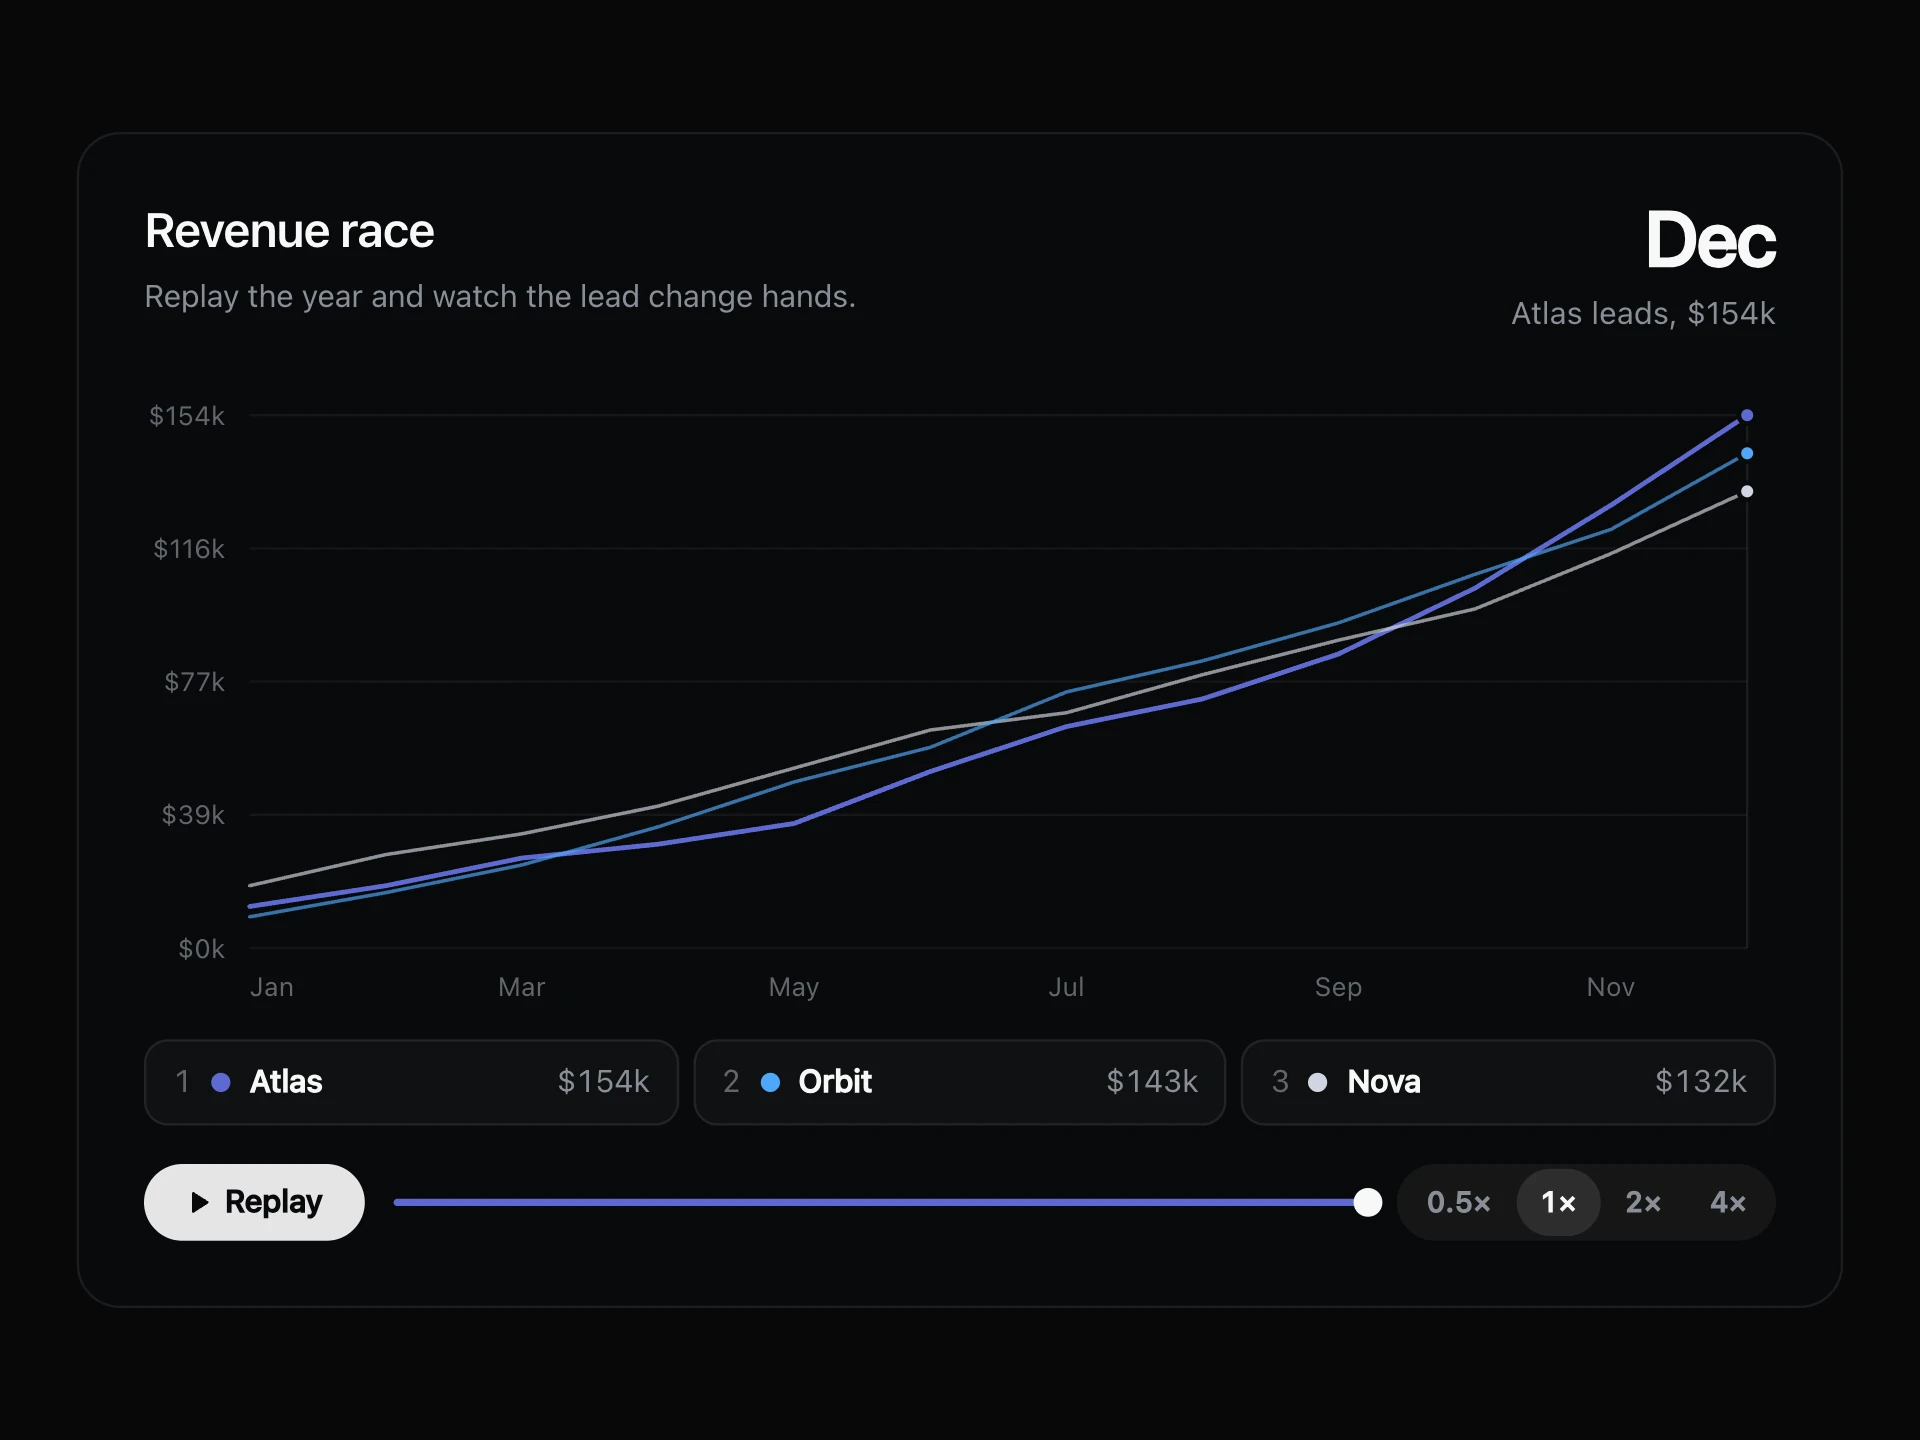
A calm multi-series area chart with monotone curves and soft fills, source toggles that show live values, a hover readout and keyboard point inspection.
About the Aurora Area Chart component
Aurora Area Chart shows how several sources build up over time without shouting. Thin curves sit over soft fills, and one large number at the top right always tells you the total for the month you are on.
Each source is a pill that shows its current value and hides the series when pressed. Hovering a month brings up a small readout, and the arrow keys do the same from the keyboard.
When to use it
Use it on dashboards for traffic, signups or revenue split by source, where the trend matters more than exact values.
For parts of a whole, Stacked Area Chart reads better, since these areas overlap rather than add up.
Installation
Add the Aurora Area Chart component to your project with the shadcn CLI. It lands in components/aurora-area-chart.tsx as plain React + Tailwind CSS source you own and can edit.
npx shadcn@latest add @reactframe/aurora-area-chartOr copy the source by hand and install its dependencies:
npm install motionProps
<AuroraAreaChart /> accepts 7 props, all optional. It also accepts the usual <section> attributes, like className, style, id and aria-*, and passes them to its root element.
| Prop | Type | Default |
|---|---|---|
| title | string | "Traffic by source" |
| subtitle | string | "A year of momentum, one source at a time." |
| theme | "dark" | "light" | "dark" |
| labels | string[] | LABELS |
| series | { label: string; values: number[]; color?: string }[] | SERIES |
| height Height of the plot, in px. | number | 280 |
| formatValue | (value: number) => string | FORMAT |
- titlestringDefault: "Traffic by source"
- subtitlestringDefault: "A year of momentum, one source at a time."
- theme"dark" | "light"Default: "dark"
- labelsstring[]Default: LABELS
- series{ label: string; values: number[]; color?: string }[]Default: SERIES
- height
Height of the plot, in px.
numberDefault: 280 - formatValue(value: number) => stringDefault: FORMAT
npm dependencies
Installed for you by the shadcn CLI.
Aurora Area Chart FAQ
- Can I use my own colours?
- Yes. Give a series a color. Without one it takes the next colour in the chart's palette, which starts with indigo.
- Does hiding a source change the scale?
- Yes. The axis fits whatever is showing, so the remaining series use the full height.
- Can I read it with a keyboard?
- Yes. Focus the chart and use the arrow keys, Home and End to move between months, and Escape to clear.
- Does the text shrink on phones?
- No. The chart is drawn at its real width, so axis labels stay the same size and fewer of them show.