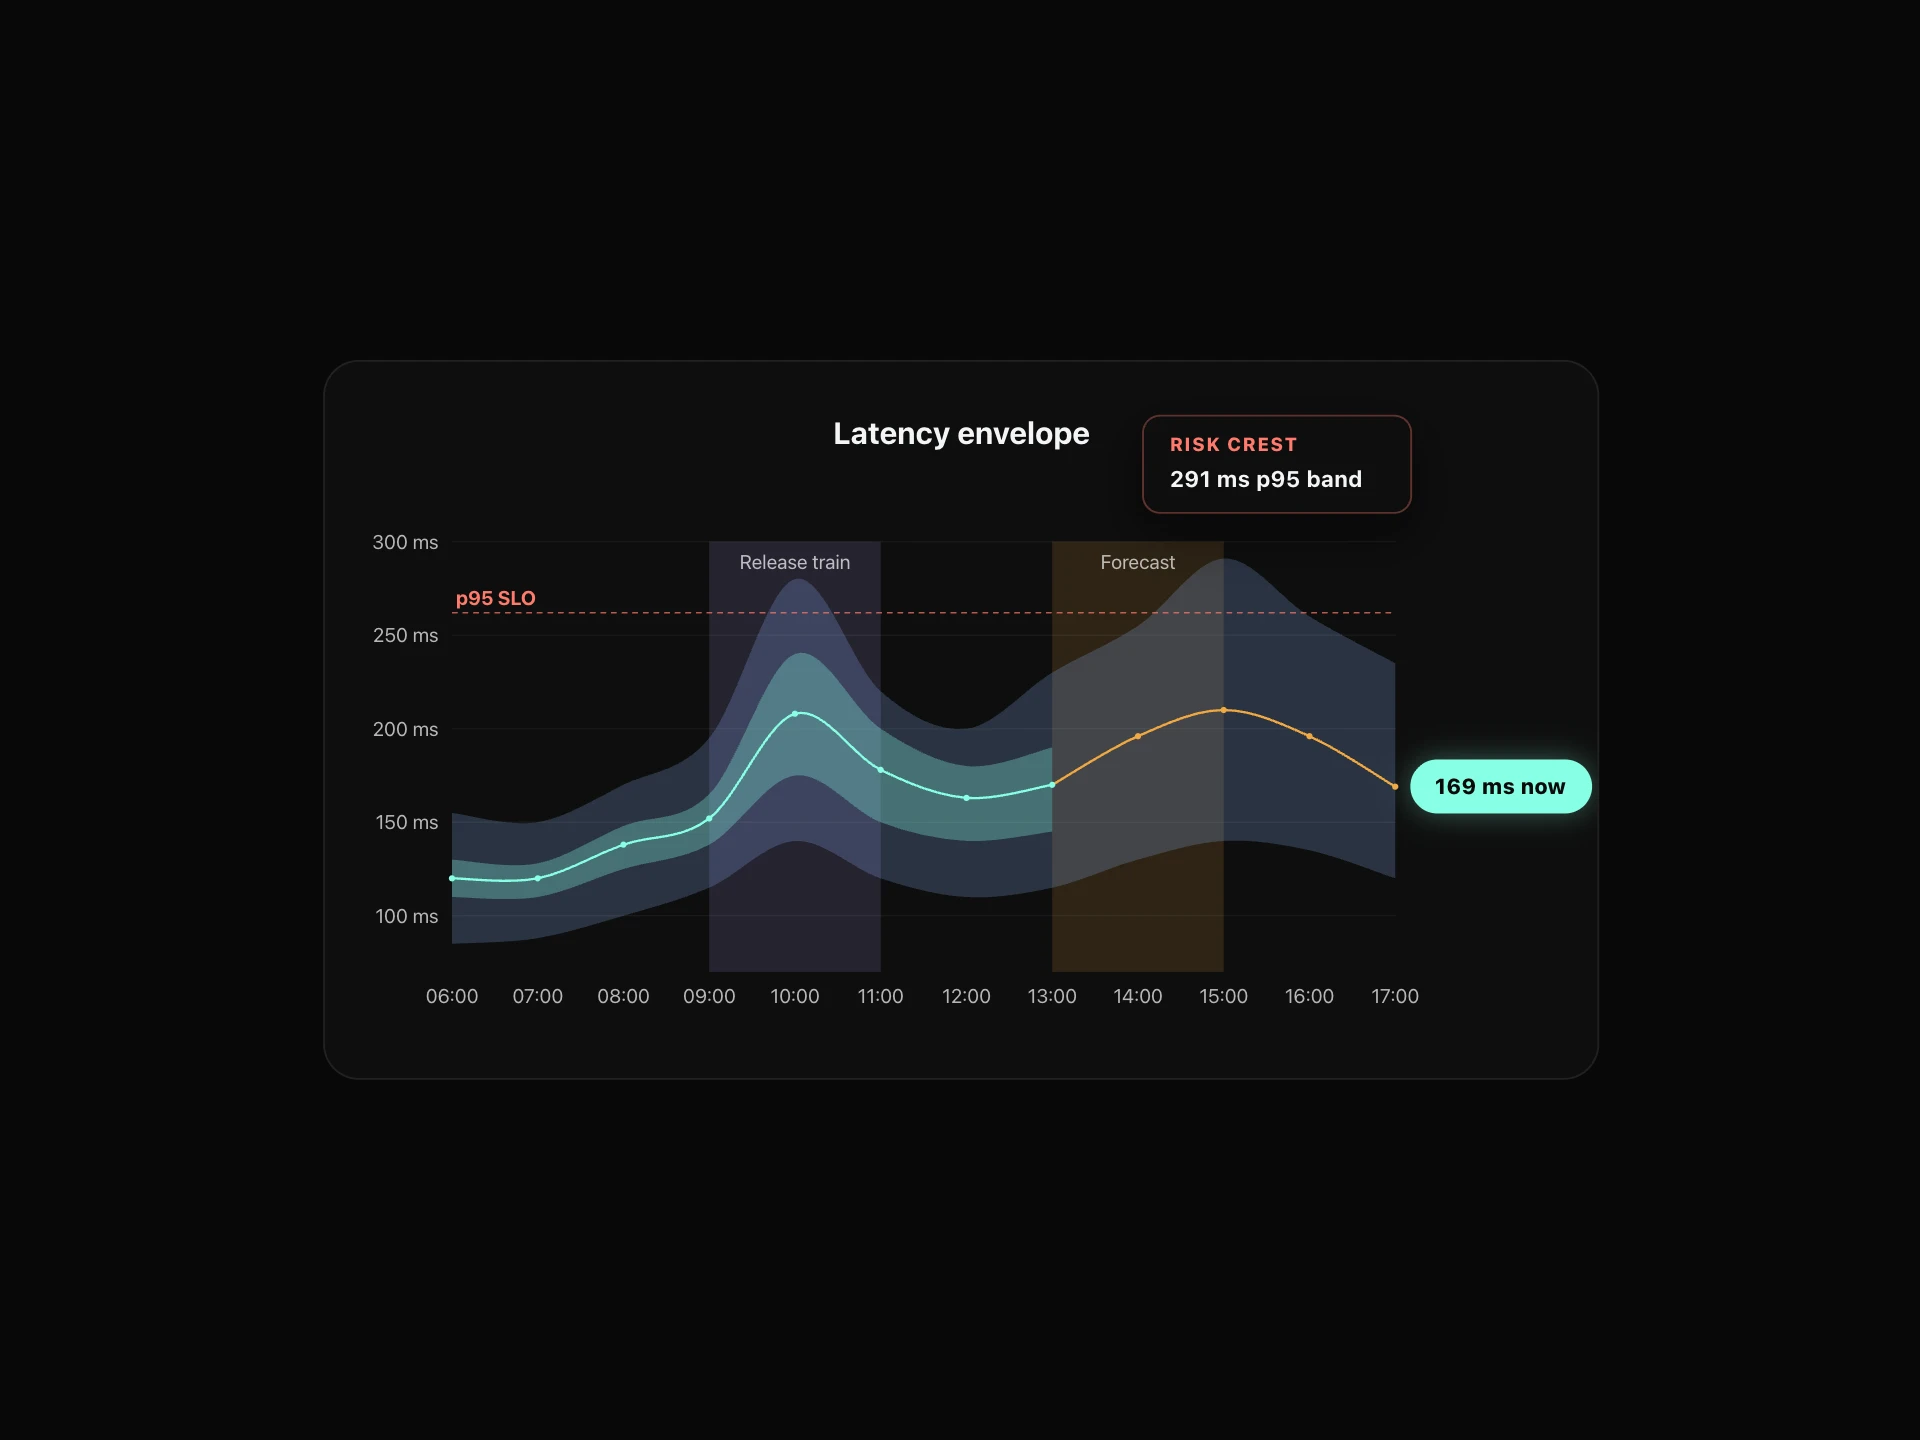
Race Replay Line Chart React component
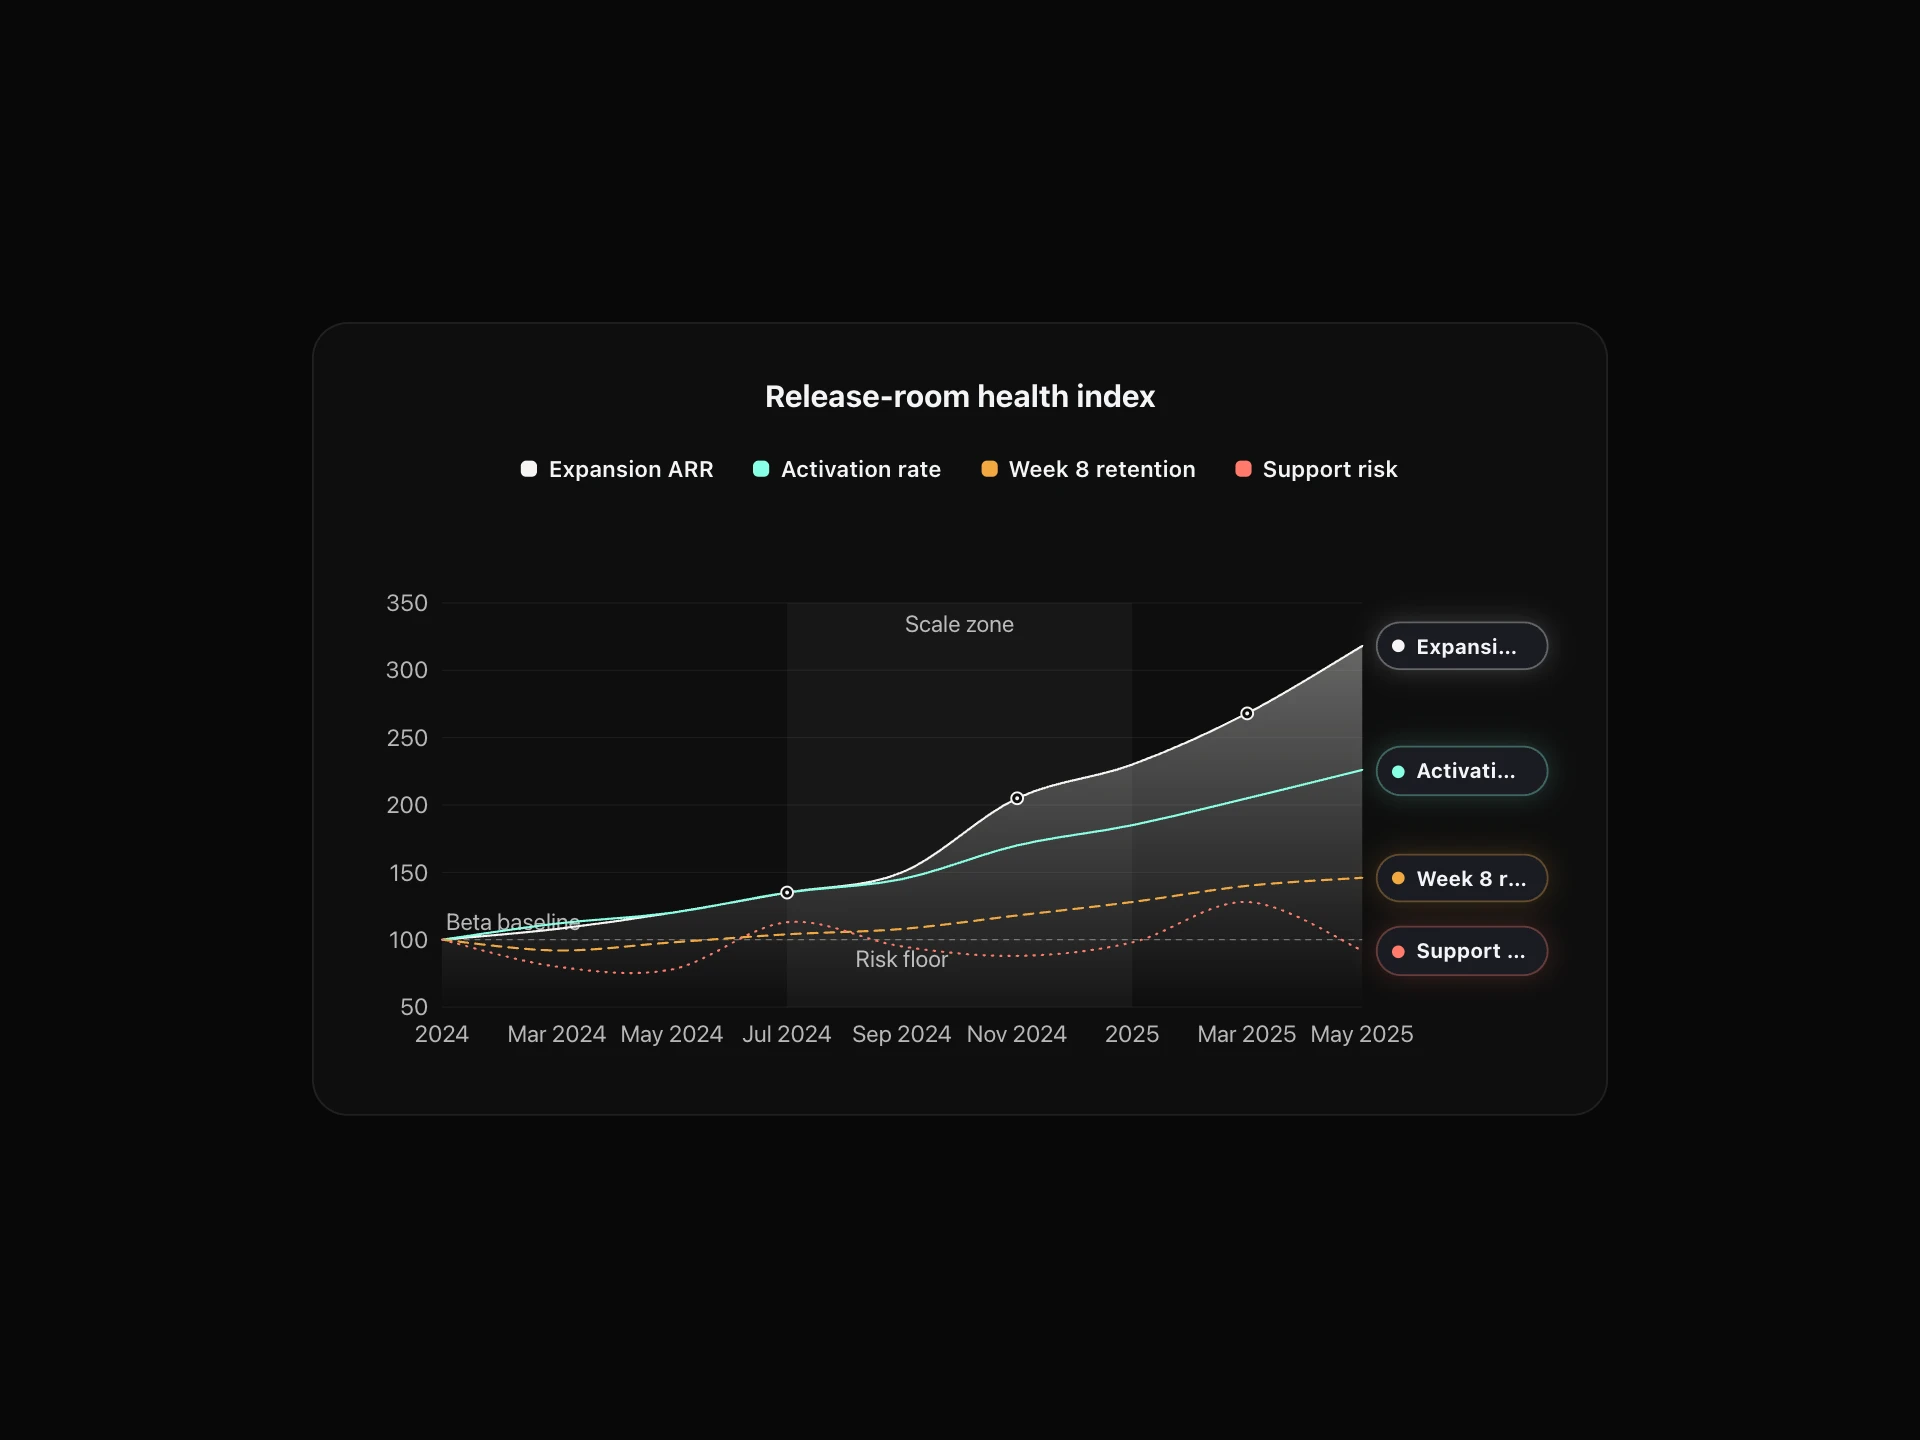
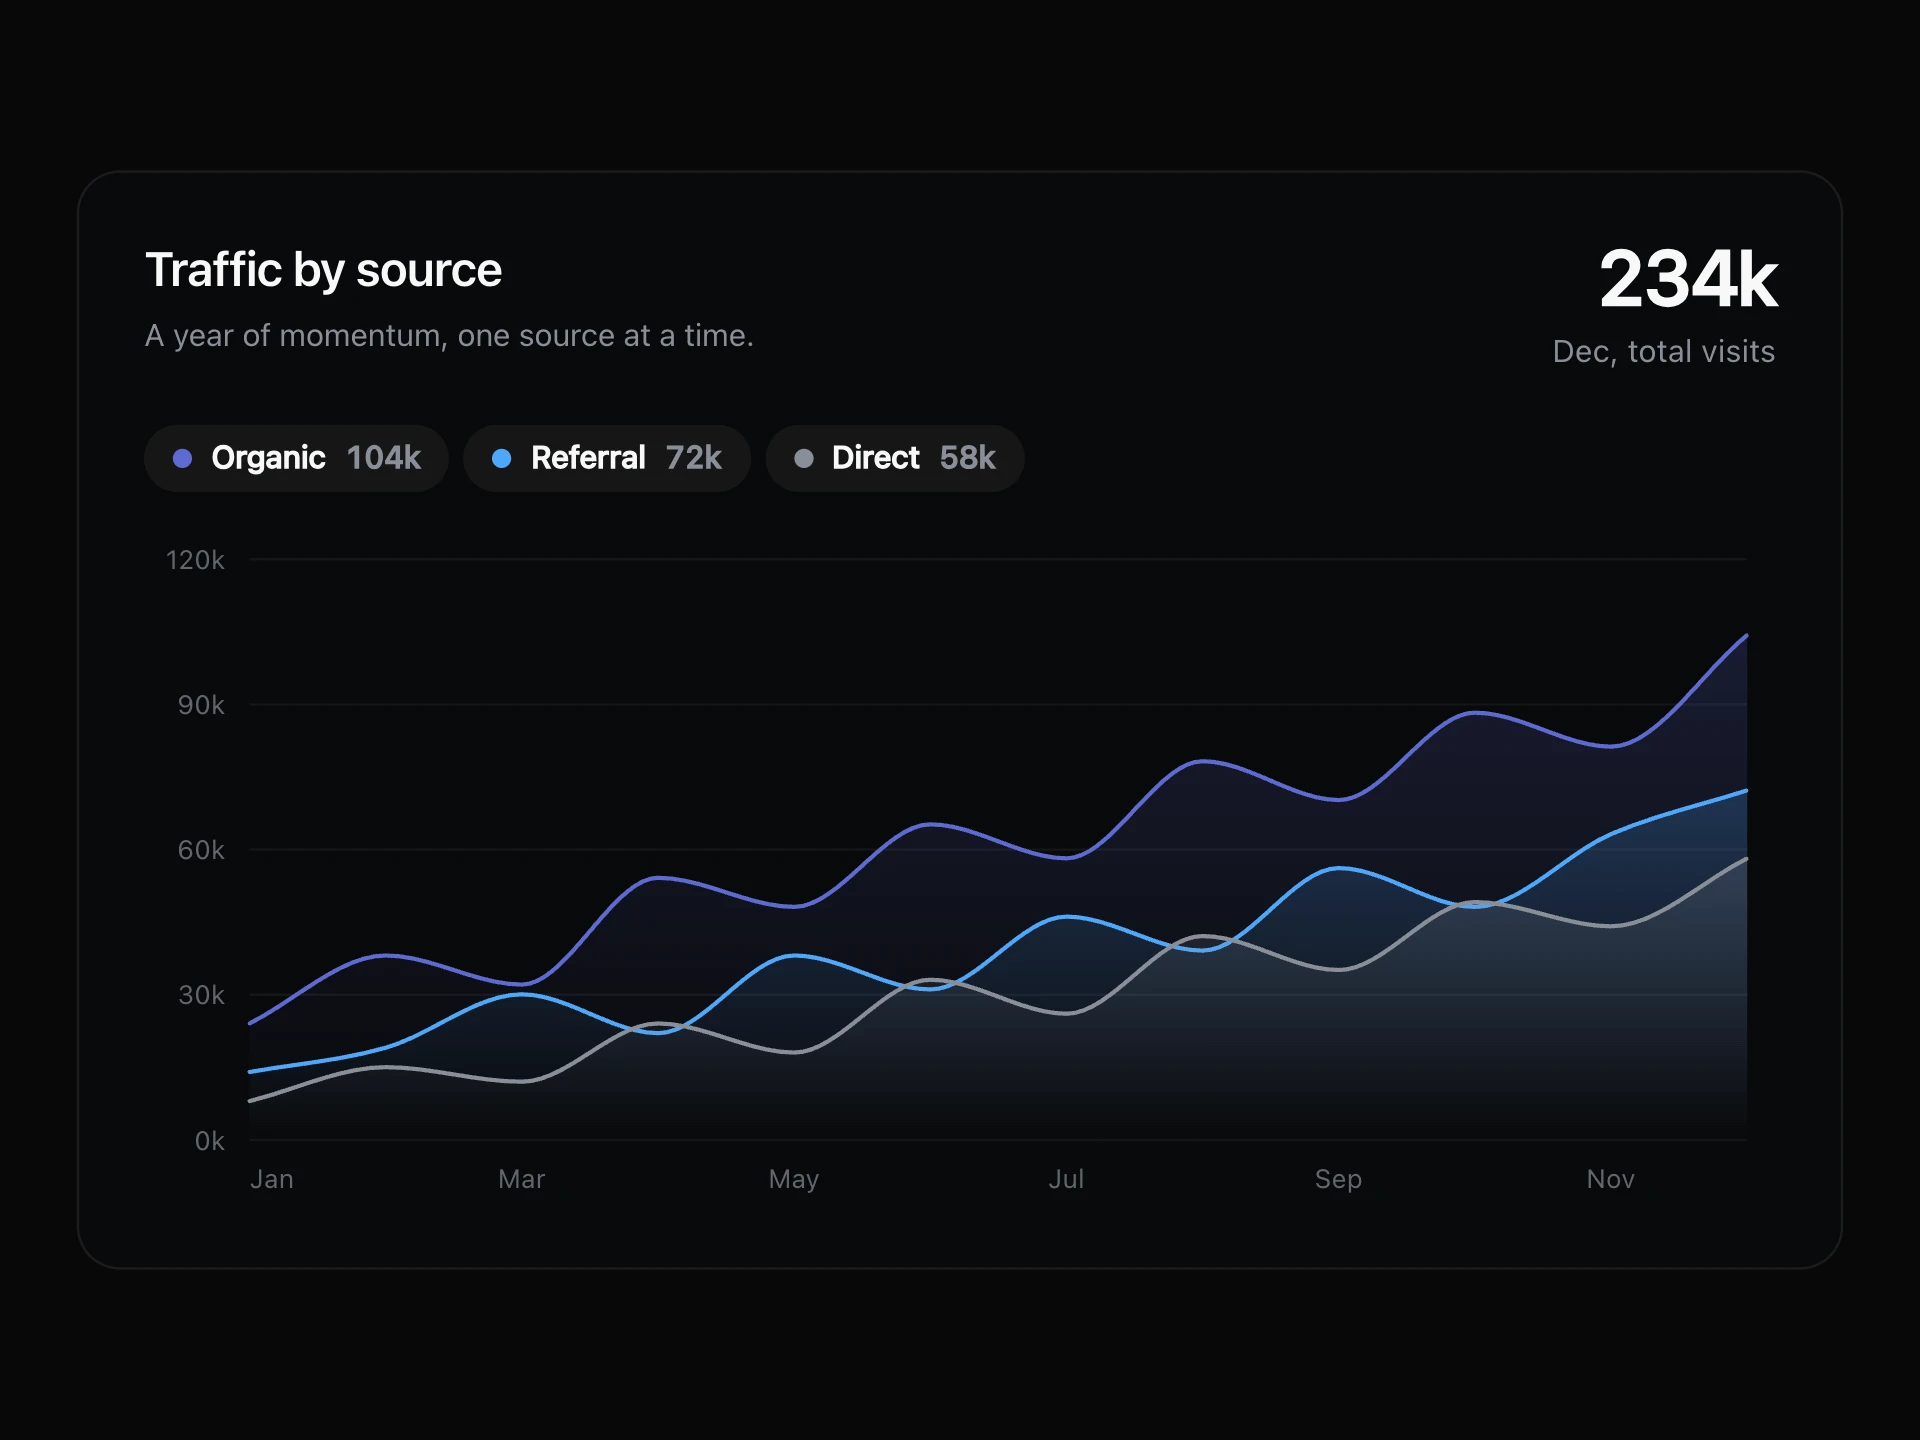
A replayable multi-series line chart: press play and the lines race through the year, the leader drawn stronger, with live rankings, a scrubber and four speeds.
About the Race Replay Line Chart component
Race Replay Line Chart turns a static comparison into a short story. Press play and the lines draw themselves through the year, with the leader drawn stronger, the ranking updating underneath and the headline naming who is in front.
A scrubber lets you stop on any moment, and four speeds control the pace. It opens on the finished chart, so the numbers are there before anyone presses play.
When to use it
Use it in reports and dashboards where the order changing over time is the point, like products, teams or regions competing.
For everyday monitoring, a plain line chart is quicker to read.
Installation
Add the Race Replay Line Chart component to your project with the shadcn CLI. It lands in components/race-replay-line-chart.tsx as plain React + Tailwind CSS source you own and can edit.
npx shadcn@latest add @reactframe/race-replay-line-chartProps
<RaceReplayLineChart /> accepts 8 props, all optional. It also accepts the usual <section> attributes, like className, style, id and aria-*, and passes them to its root element.
| Prop | Type | Default |
|---|---|---|
| title | string | "Revenue race" |
| subtitle | string | "Replay the year and watch the lead change hands." |
| theme | "dark" | "light" | "dark" |
| labels | string[] | LABELS |
| series | { label: string; values: number[]; color?: string }[] | SERIES |
| duration Length of one replay at 1× speed, in seconds. | number | 12 |
| height Height of the plot, in px. | number | 260 |
| formatValue | (value: number) => string | FORMAT |
- titlestringDefault: "Revenue race"
- subtitlestringDefault: "Replay the year and watch the lead change hands."
- theme"dark" | "light"Default: "dark"
- labelsstring[]Default: LABELS
- series{ label: string; values: number[]; color?: string }[]Default: SERIES
- duration
Length of one replay at 1× speed, in seconds.
numberDefault: 12 - height
Height of the plot, in px.
numberDefault: 260 - formatValue(value: number) => stringDefault: FORMAT
Race Replay Line Chart FAQ
- Does it play by itself?
- No. It opens on the final state and only runs when someone presses play.
- Does it keep running off screen?
- No. Playback pauses when the chart scrolls away or the tab is hidden, and picks up where it stopped.
- How long does a replay take?
- duration sets the length at 1× speed, in seconds. The default is 12.
- Can I set the line colours?
- Yes. Give a series a color. Without one it takes the next colour in the chart's palette.