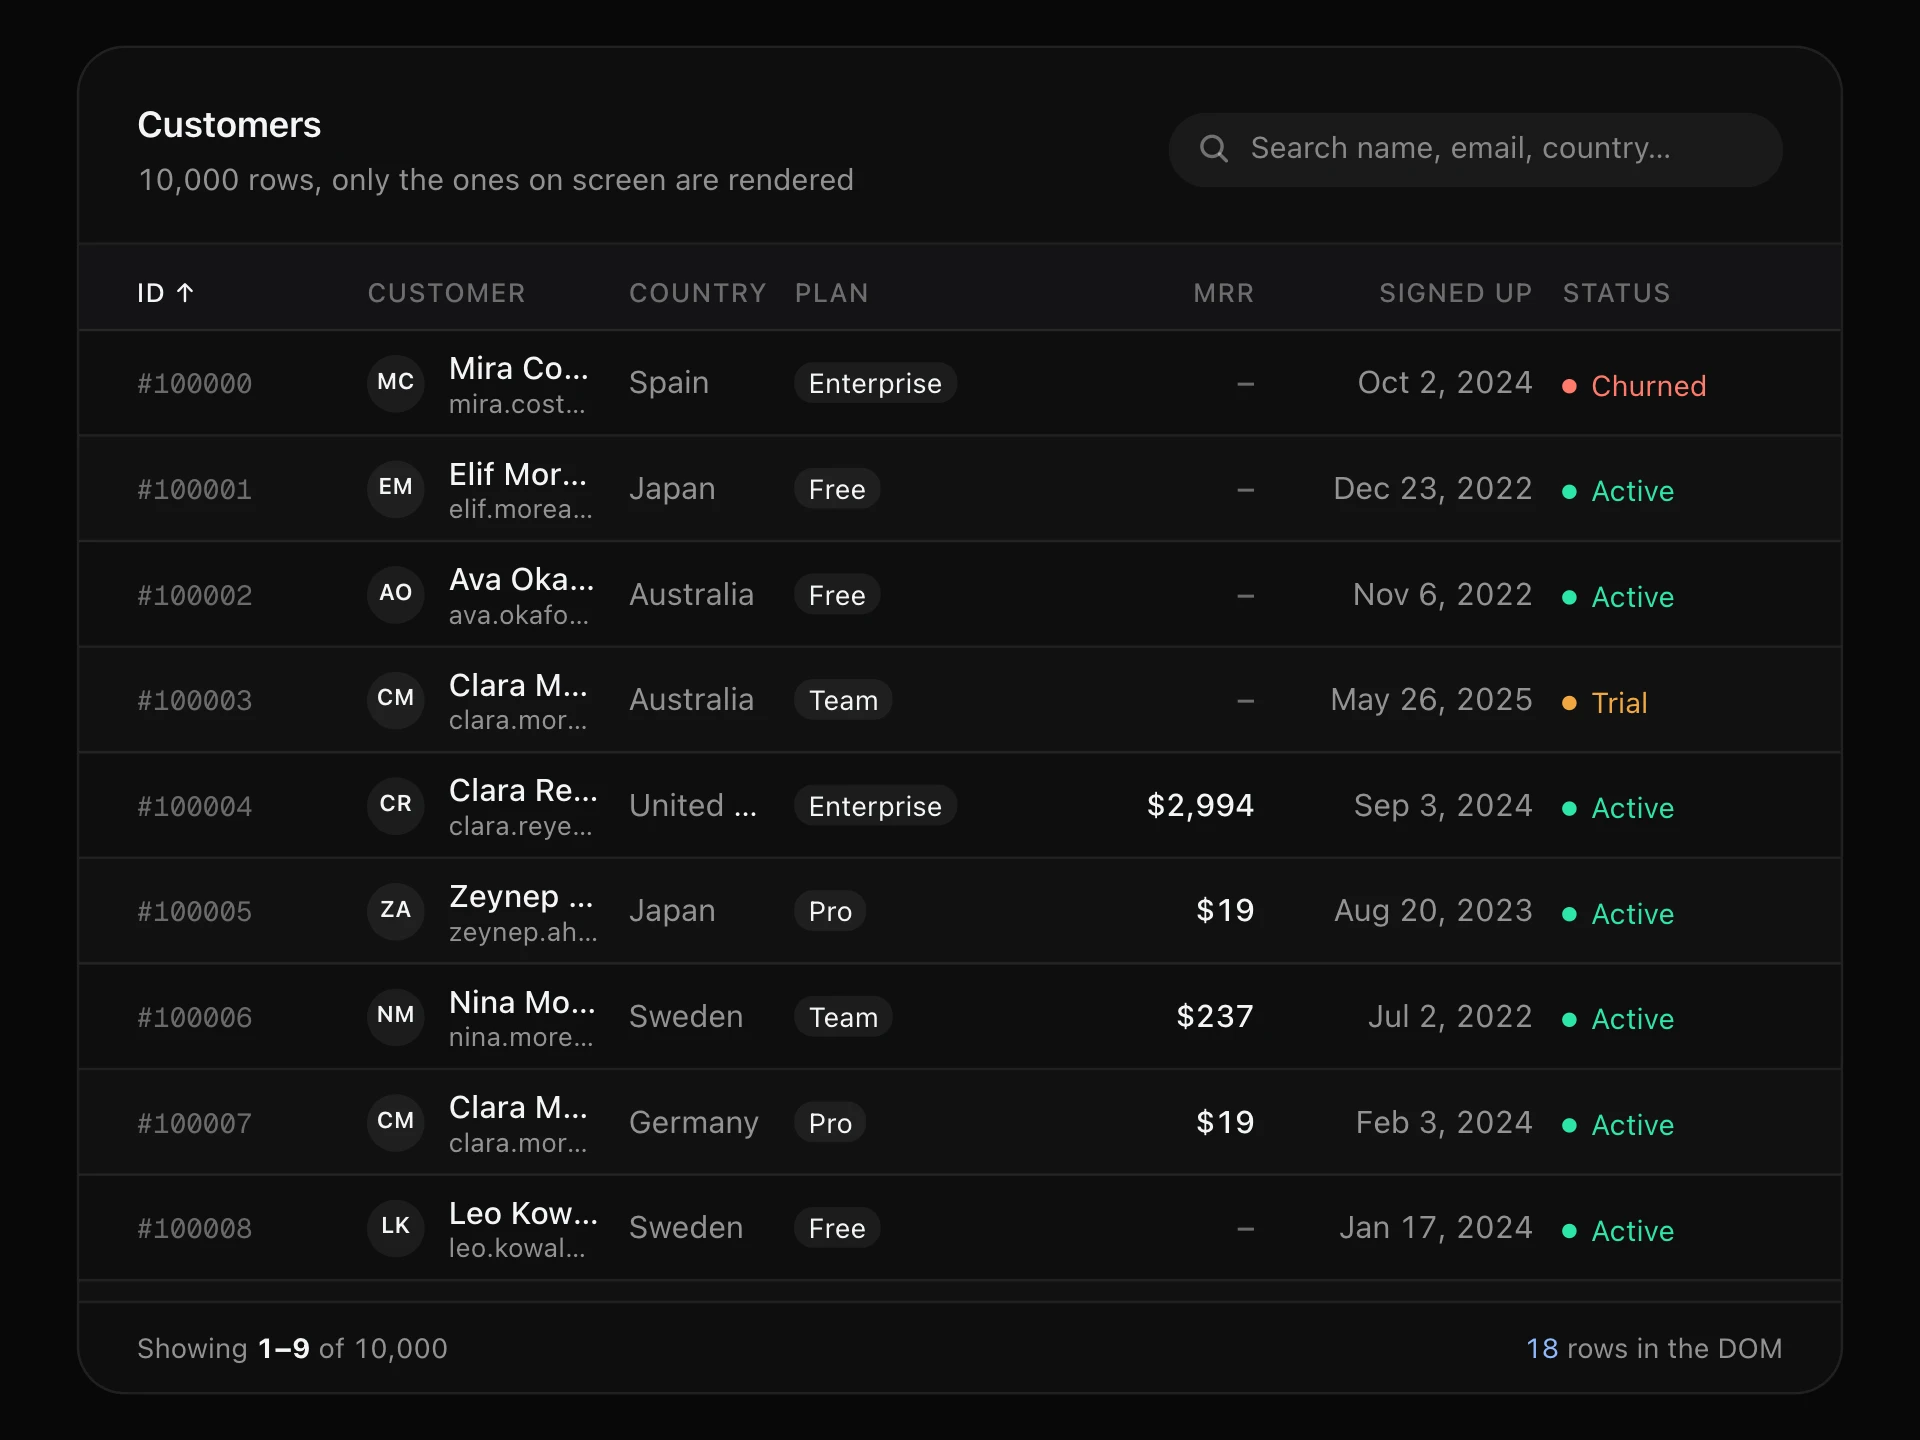
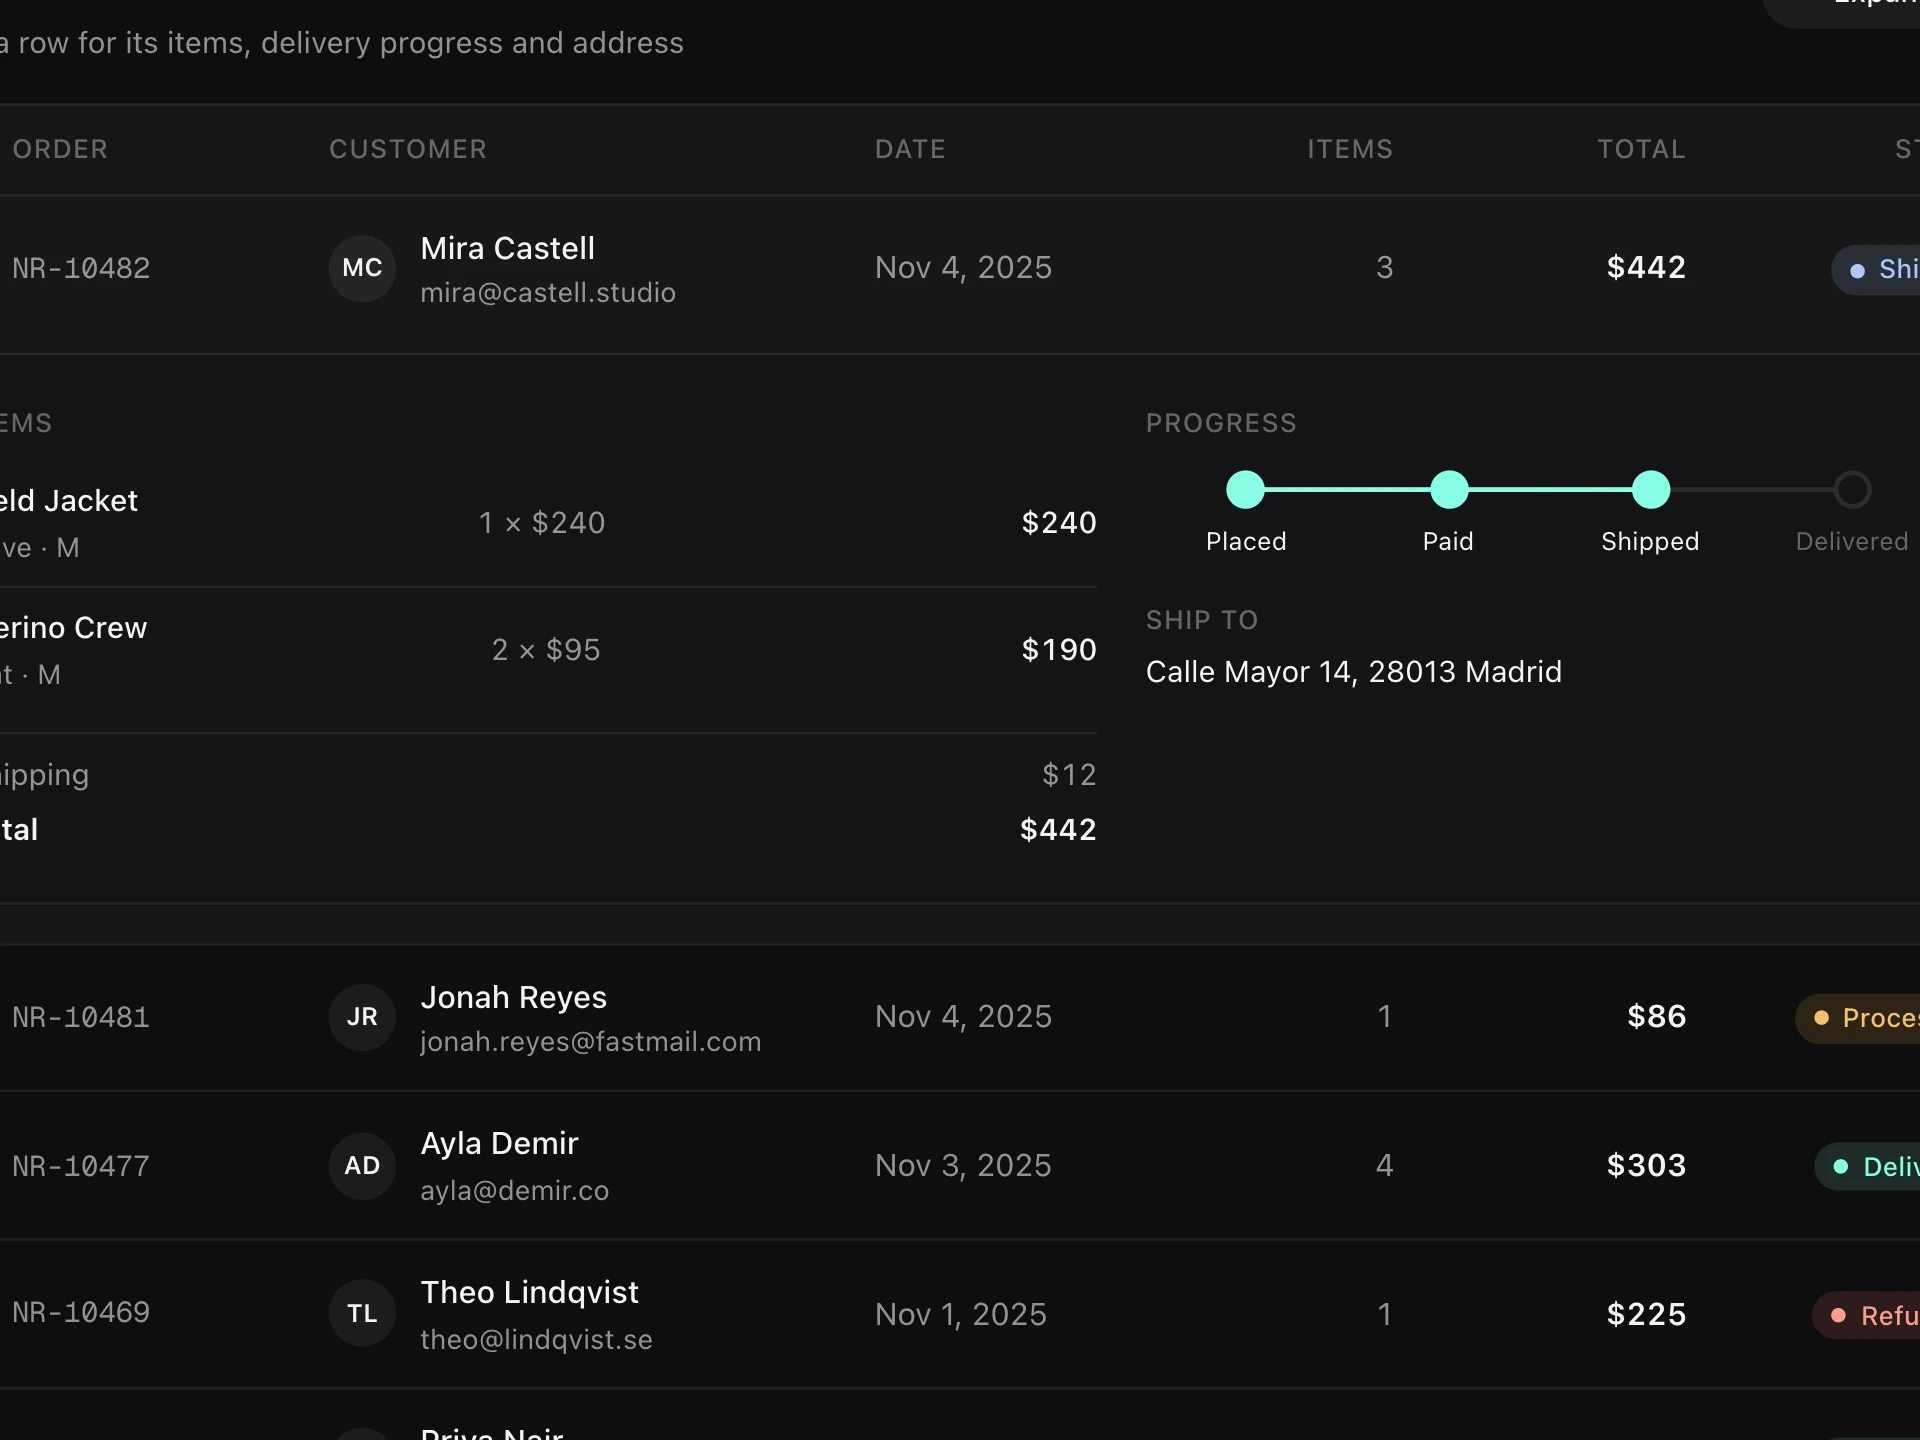
Sparkline Table React component
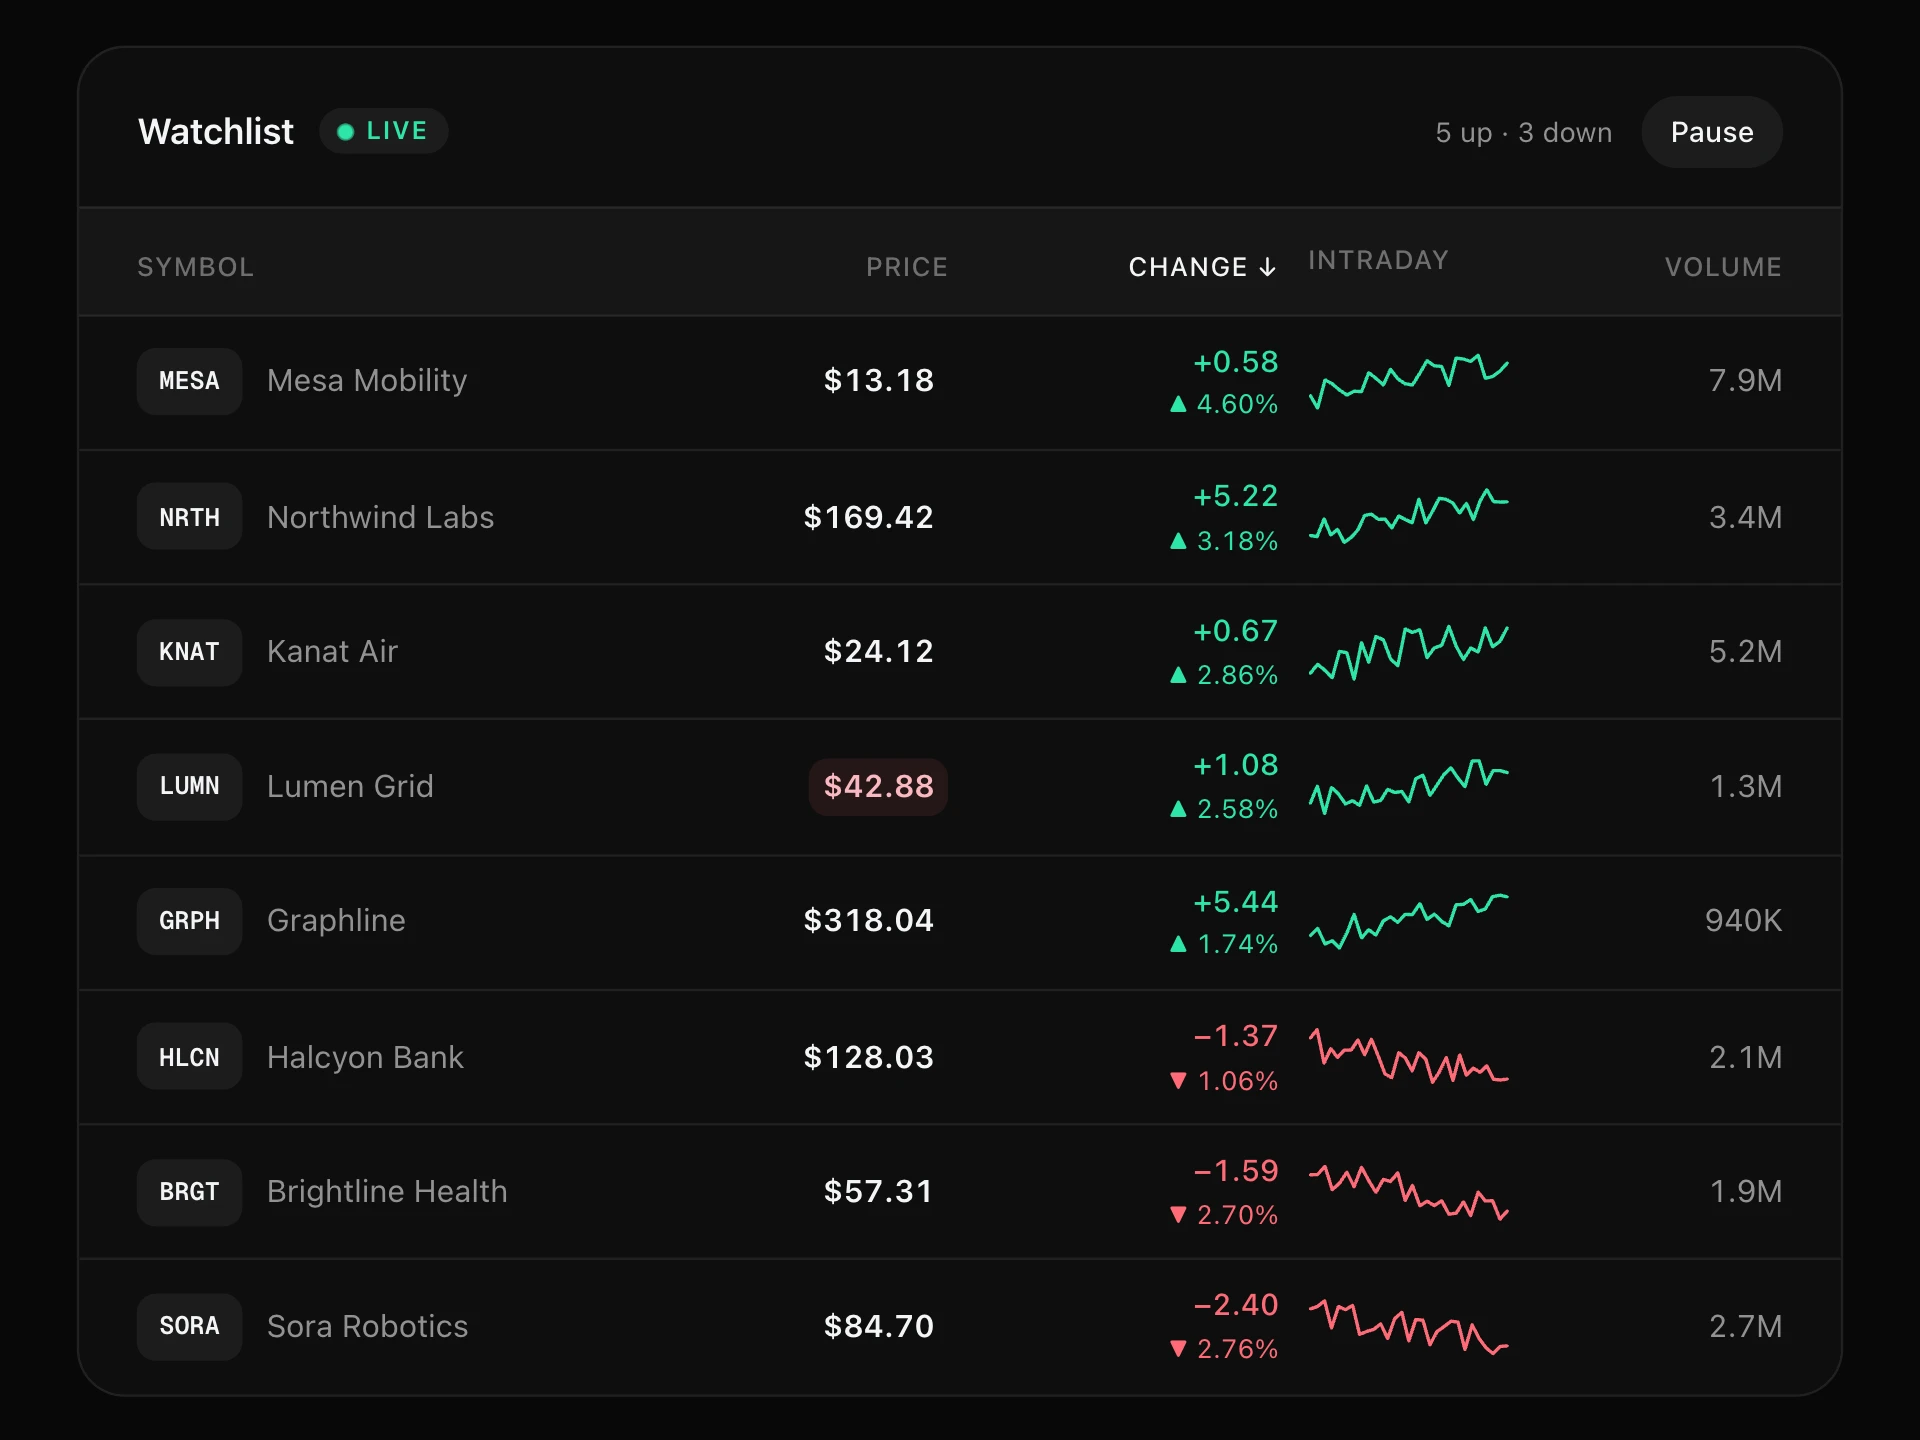
A product table with a tiny trend chart in every row: 30-day sparklines coloured by direction, hover for any day's value, revenue with share bars, week-over-week change pills and sortable columns.
About the Sparkline Table component
Sparkline Table adds a tiny trend chart to every row, so a list of products, pages or accounts shows not just how big each one is but which way it's heading. Sparklines turn green or red with the last week's change, and hovering one shows the value for any day.
Revenue gets a share bar, the week-over-week change gets a coloured pill, and every numeric column sorts with a click.
When to use it
Use it for top products, landing pages, campaigns, API endpoints, accounts or stocks: any ranked list where the trend matters as much as the total.
For one item's history, use a full line chart; sparklines are for comparing shapes across many rows.
Installation
Add the Sparkline Table component to your project with the shadcn CLI. It lands in components/sparkline-table.tsx as plain React + Tailwind CSS source you own and can edit.
npx shadcn@latest add @reactframe/sparkline-tableOr copy the source by hand and install its dependencies:
npm install clsx tailwind-mergeProps
<SparklineTable /> accepts 6 props, all optional. It also accepts the usual <div> attributes, like className, style, id and aria-*, and passes them to its root element.
| Prop | Type | Default |
|---|---|---|
| theme | "dark" | "light" | "dark" |
| title | string | "Top products" |
| subtitle | string | "Last 30 days · sort by any column, hover a trend for daily units" |
| rows | { name: string; category?: string; price: number; series: number[] }[] | DEFAULT_ROWS |
| endLabel Label of the last day in the series; earlier days count back from it. | string | "Nov 5" |
| currency | string | "$" |
- theme"dark" | "light"Default: "dark"
- titlestringDefault: "Top products"
- subtitlestringDefault: "Last 30 days · sort by any column, hover a trend for daily units"
- rows{ name: string; category?: string; price: number; series: number[] }[]Default: DEFAULT_ROWS
- endLabel
Label of the last day in the series; earlier days count back from it.
stringDefault: "Nov 5" - currencystringDefault: "$"
npm dependencies
Installed for you by the shadcn CLI.
Sparkline Table FAQ
- What data does each row need?
- { name, category?, price, series }, where series is one number per day, oldest first. Units, revenue and the 7-day change are worked out from it.
- How is the change calculated?
- The last 7 values against the 7 before them. It also decides whether the sparkline and pill are green or red.
- Can I sort it?
- Every column except the trend sorts: click a header to sort, click again to flip direction. The headers carry aria-sort so screen readers announce the order.
- What happens on phones?
- Below 640px wide price and units are hidden and the sparklines get narrower, so product, revenue, trend and change still fit.