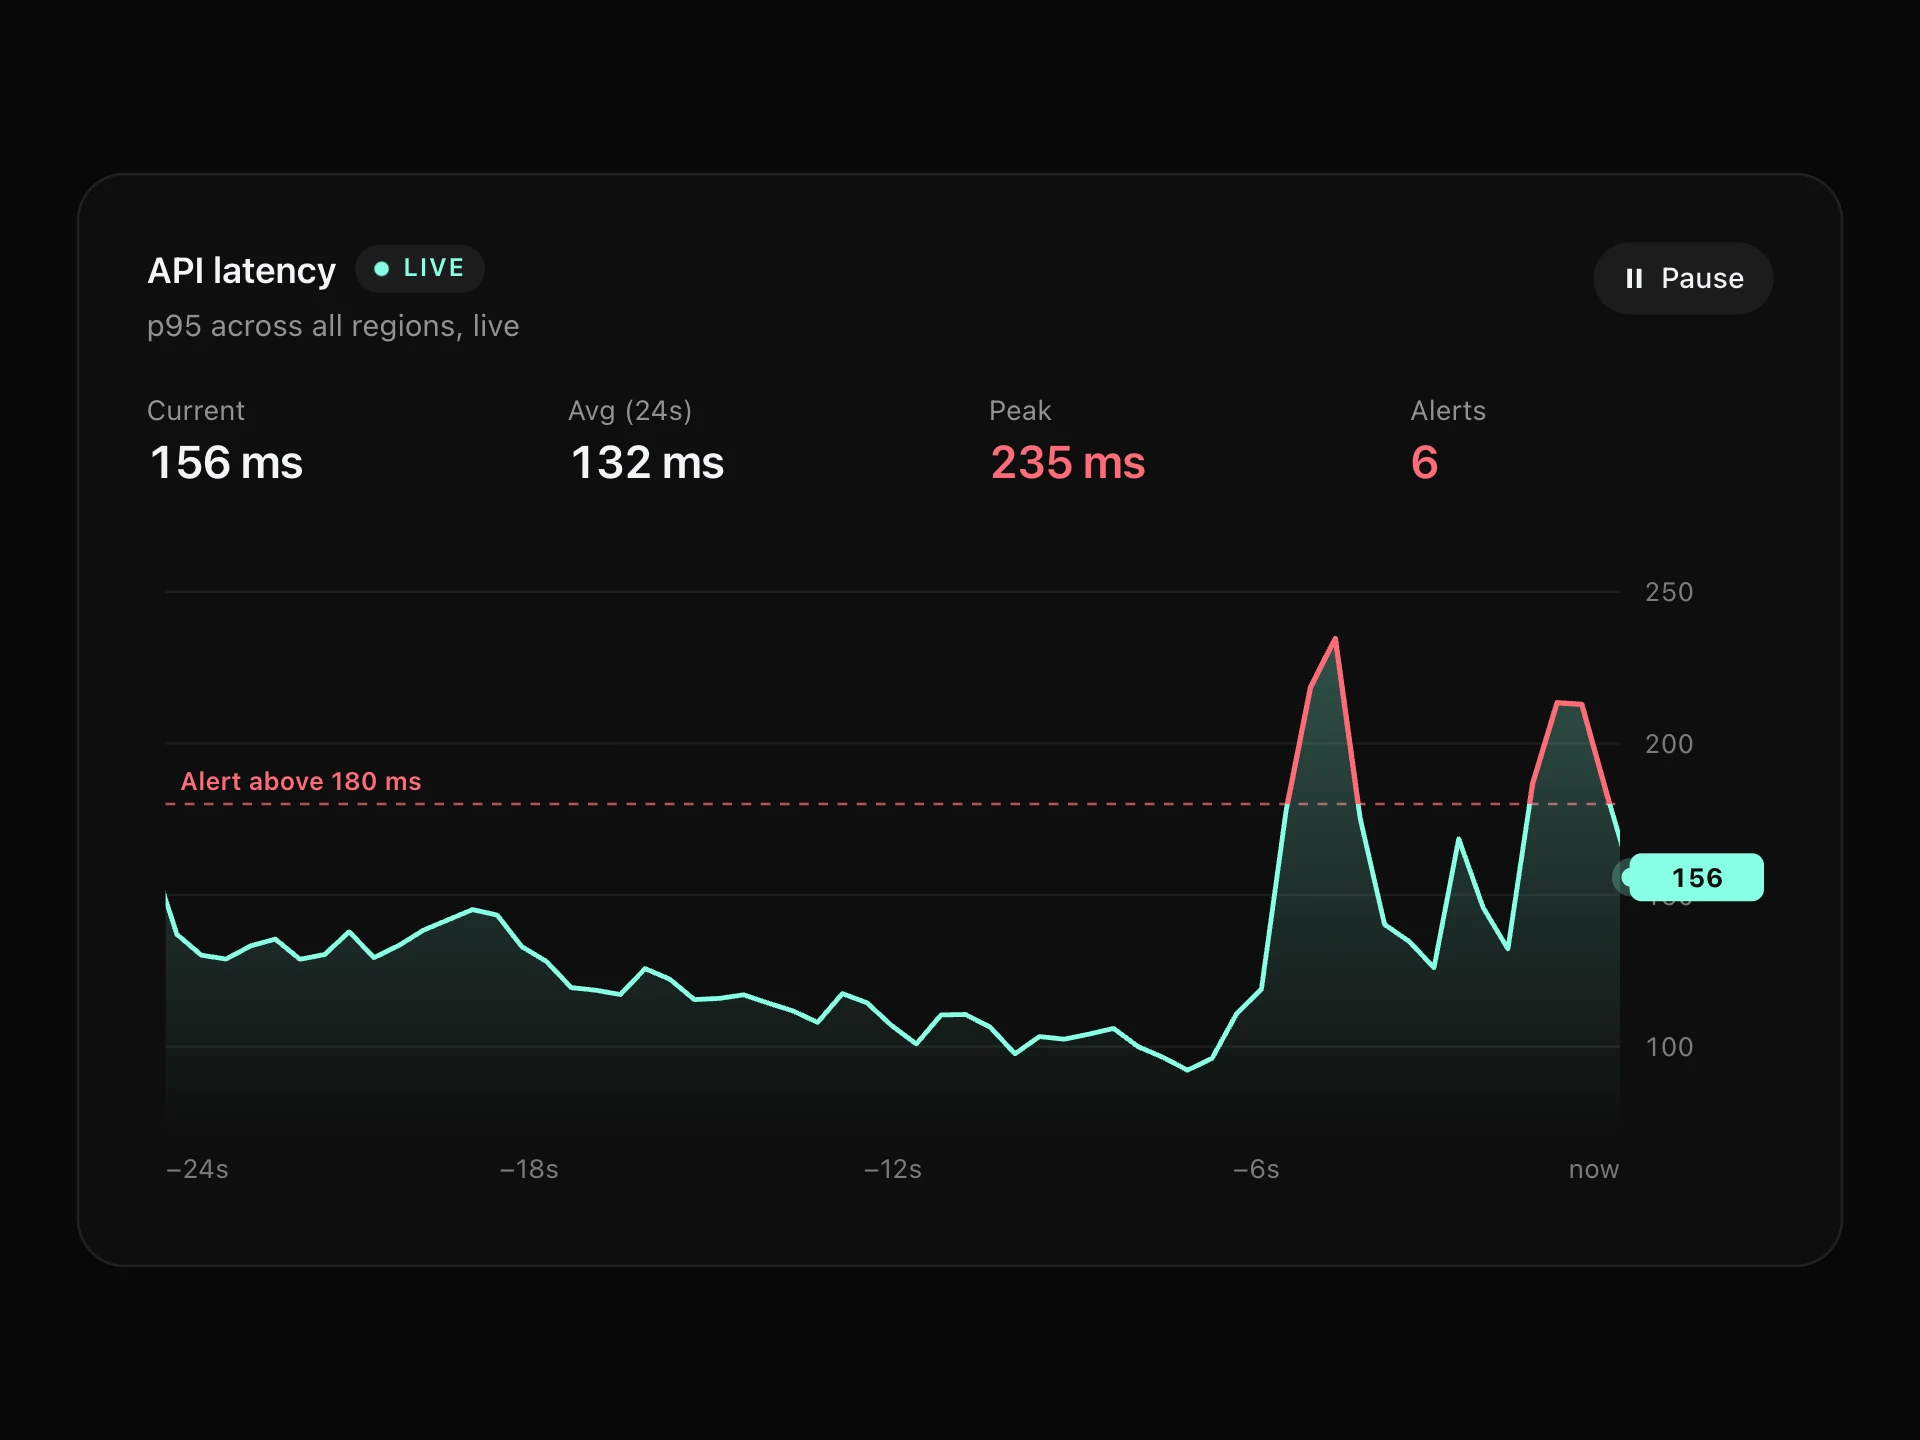
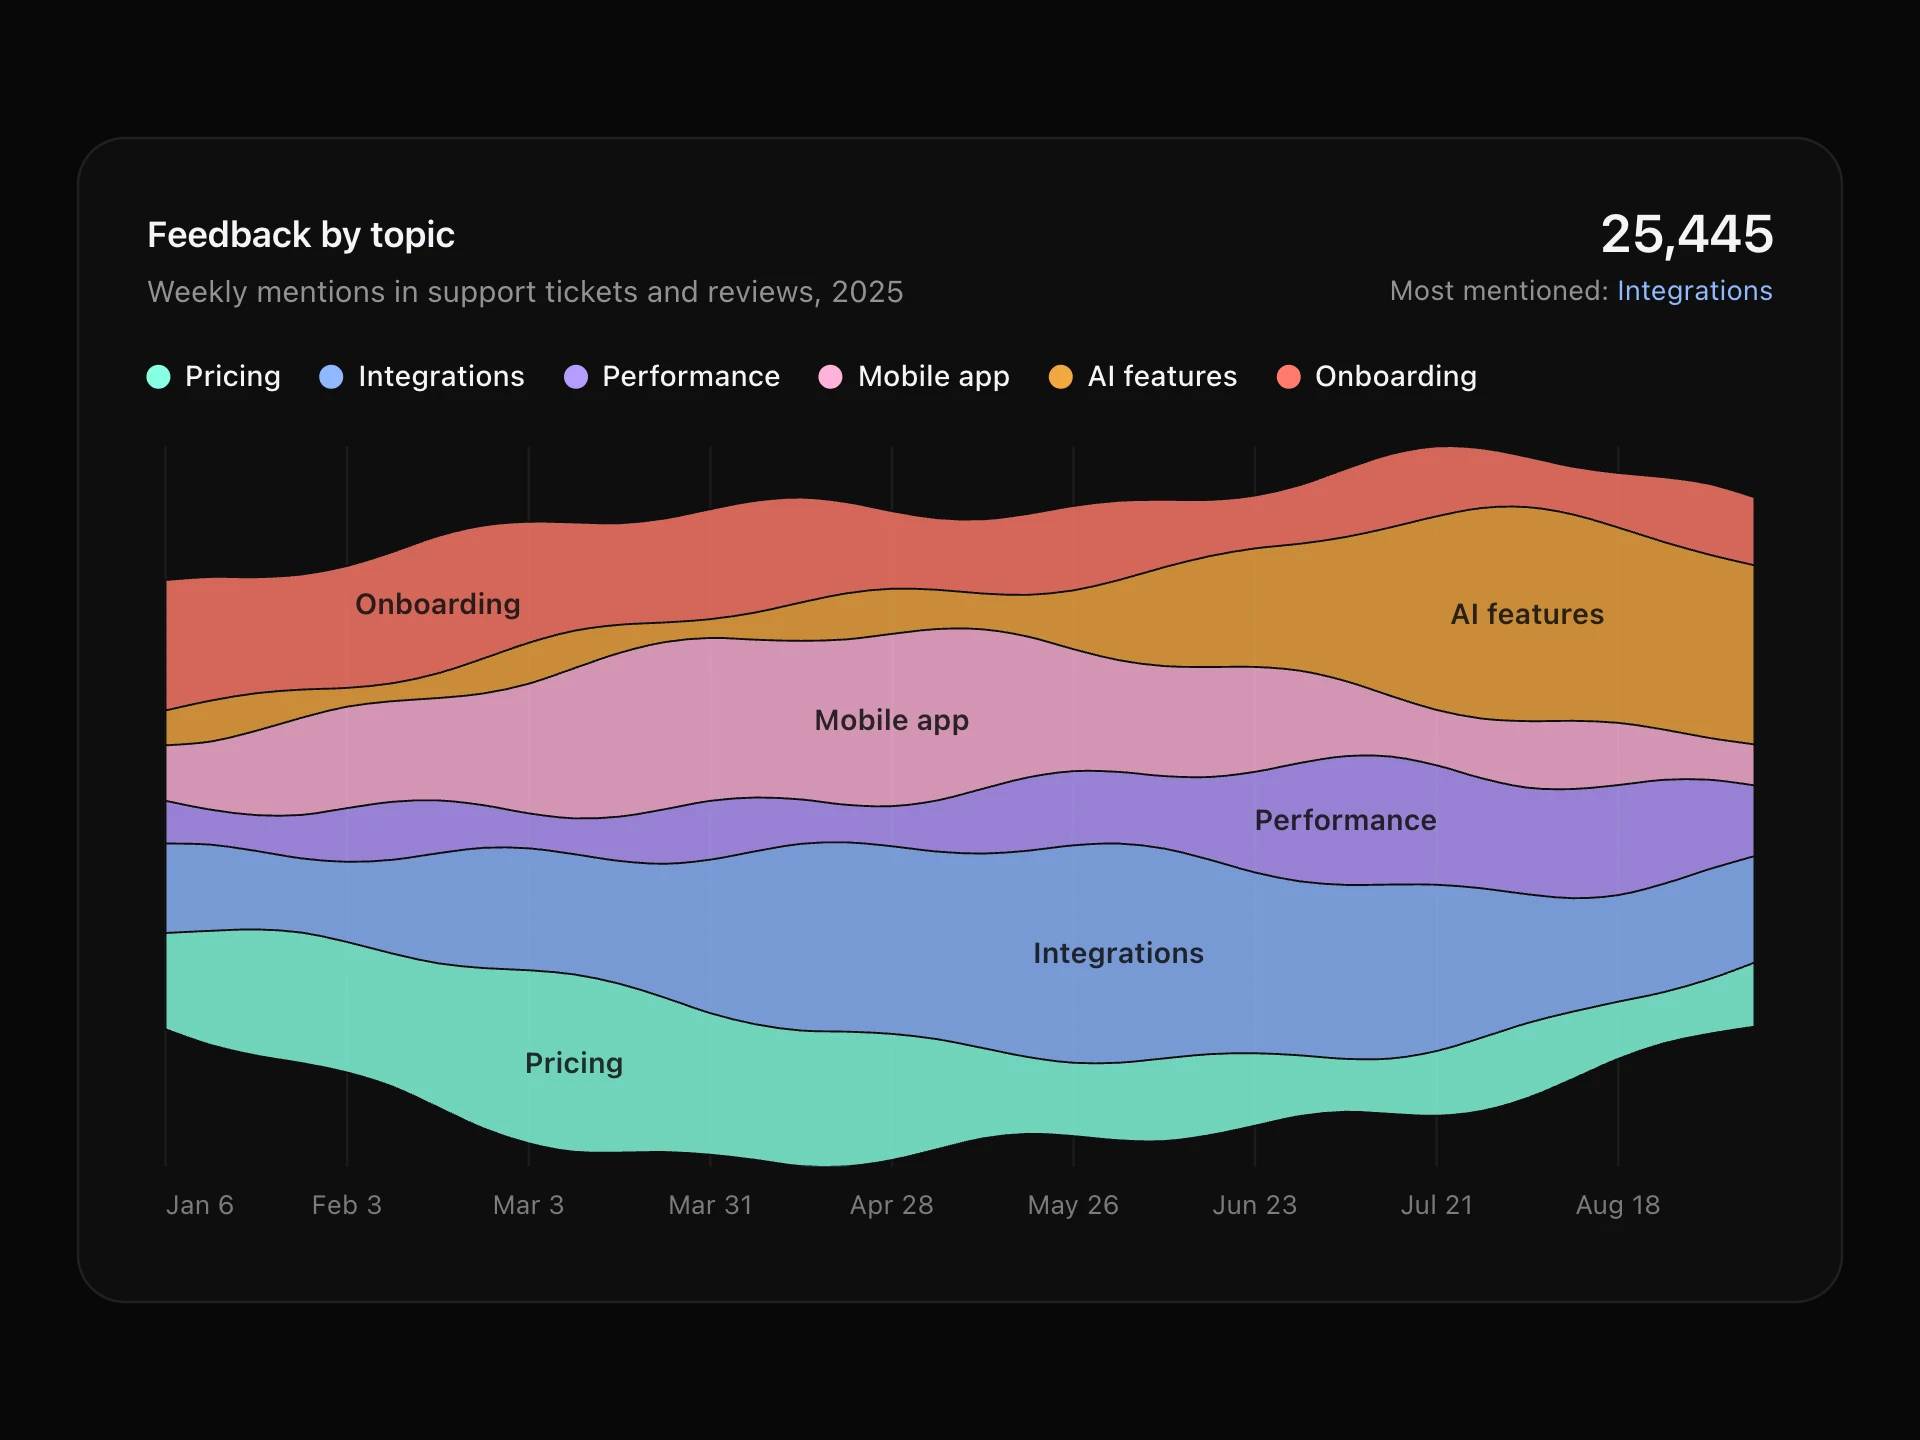
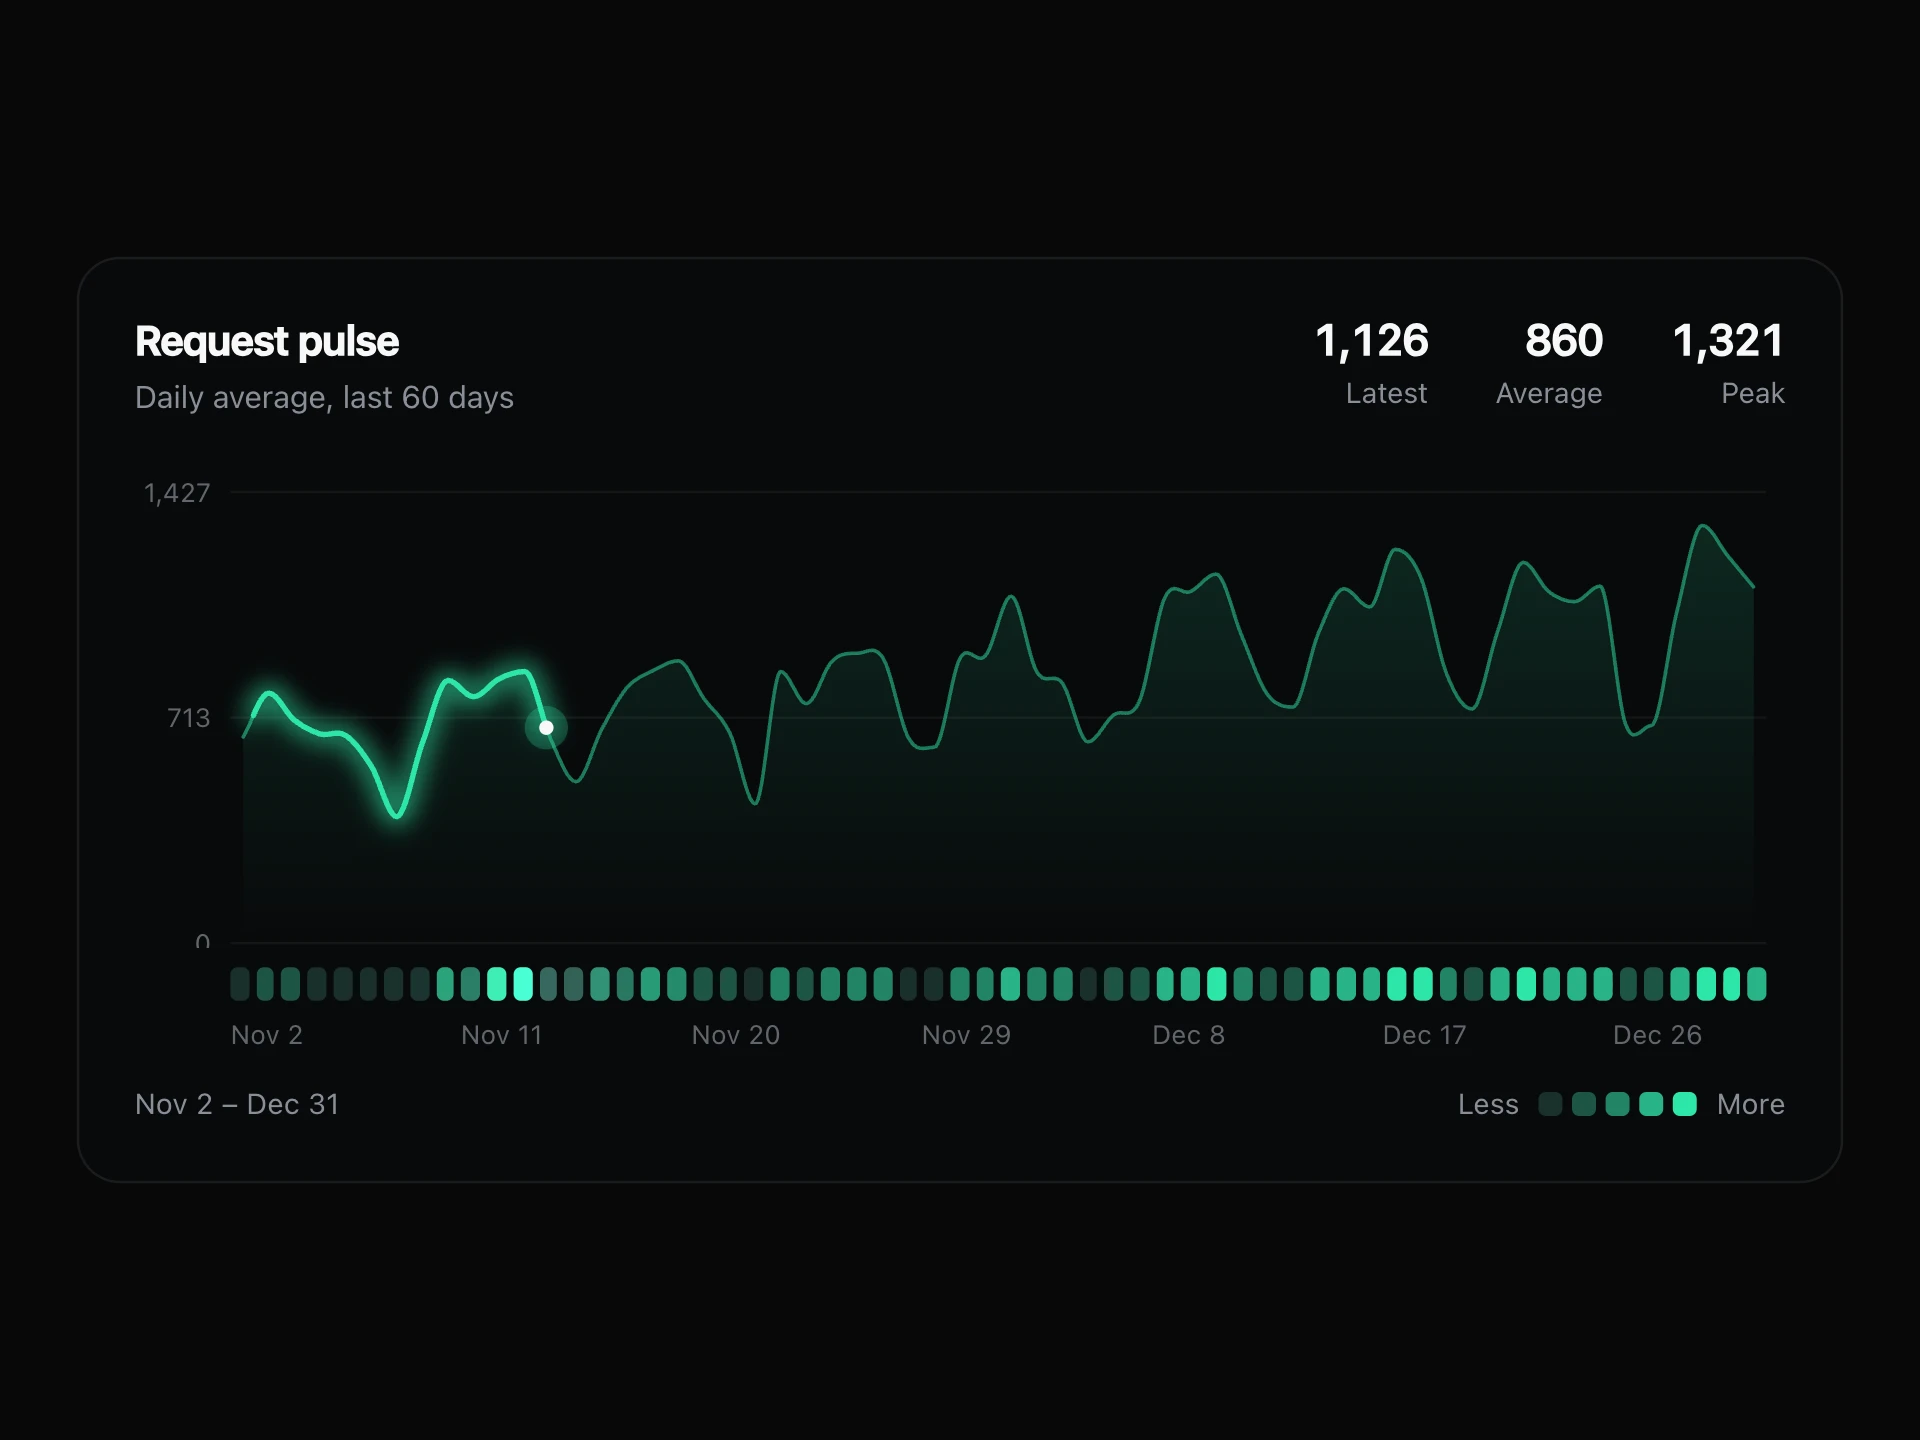
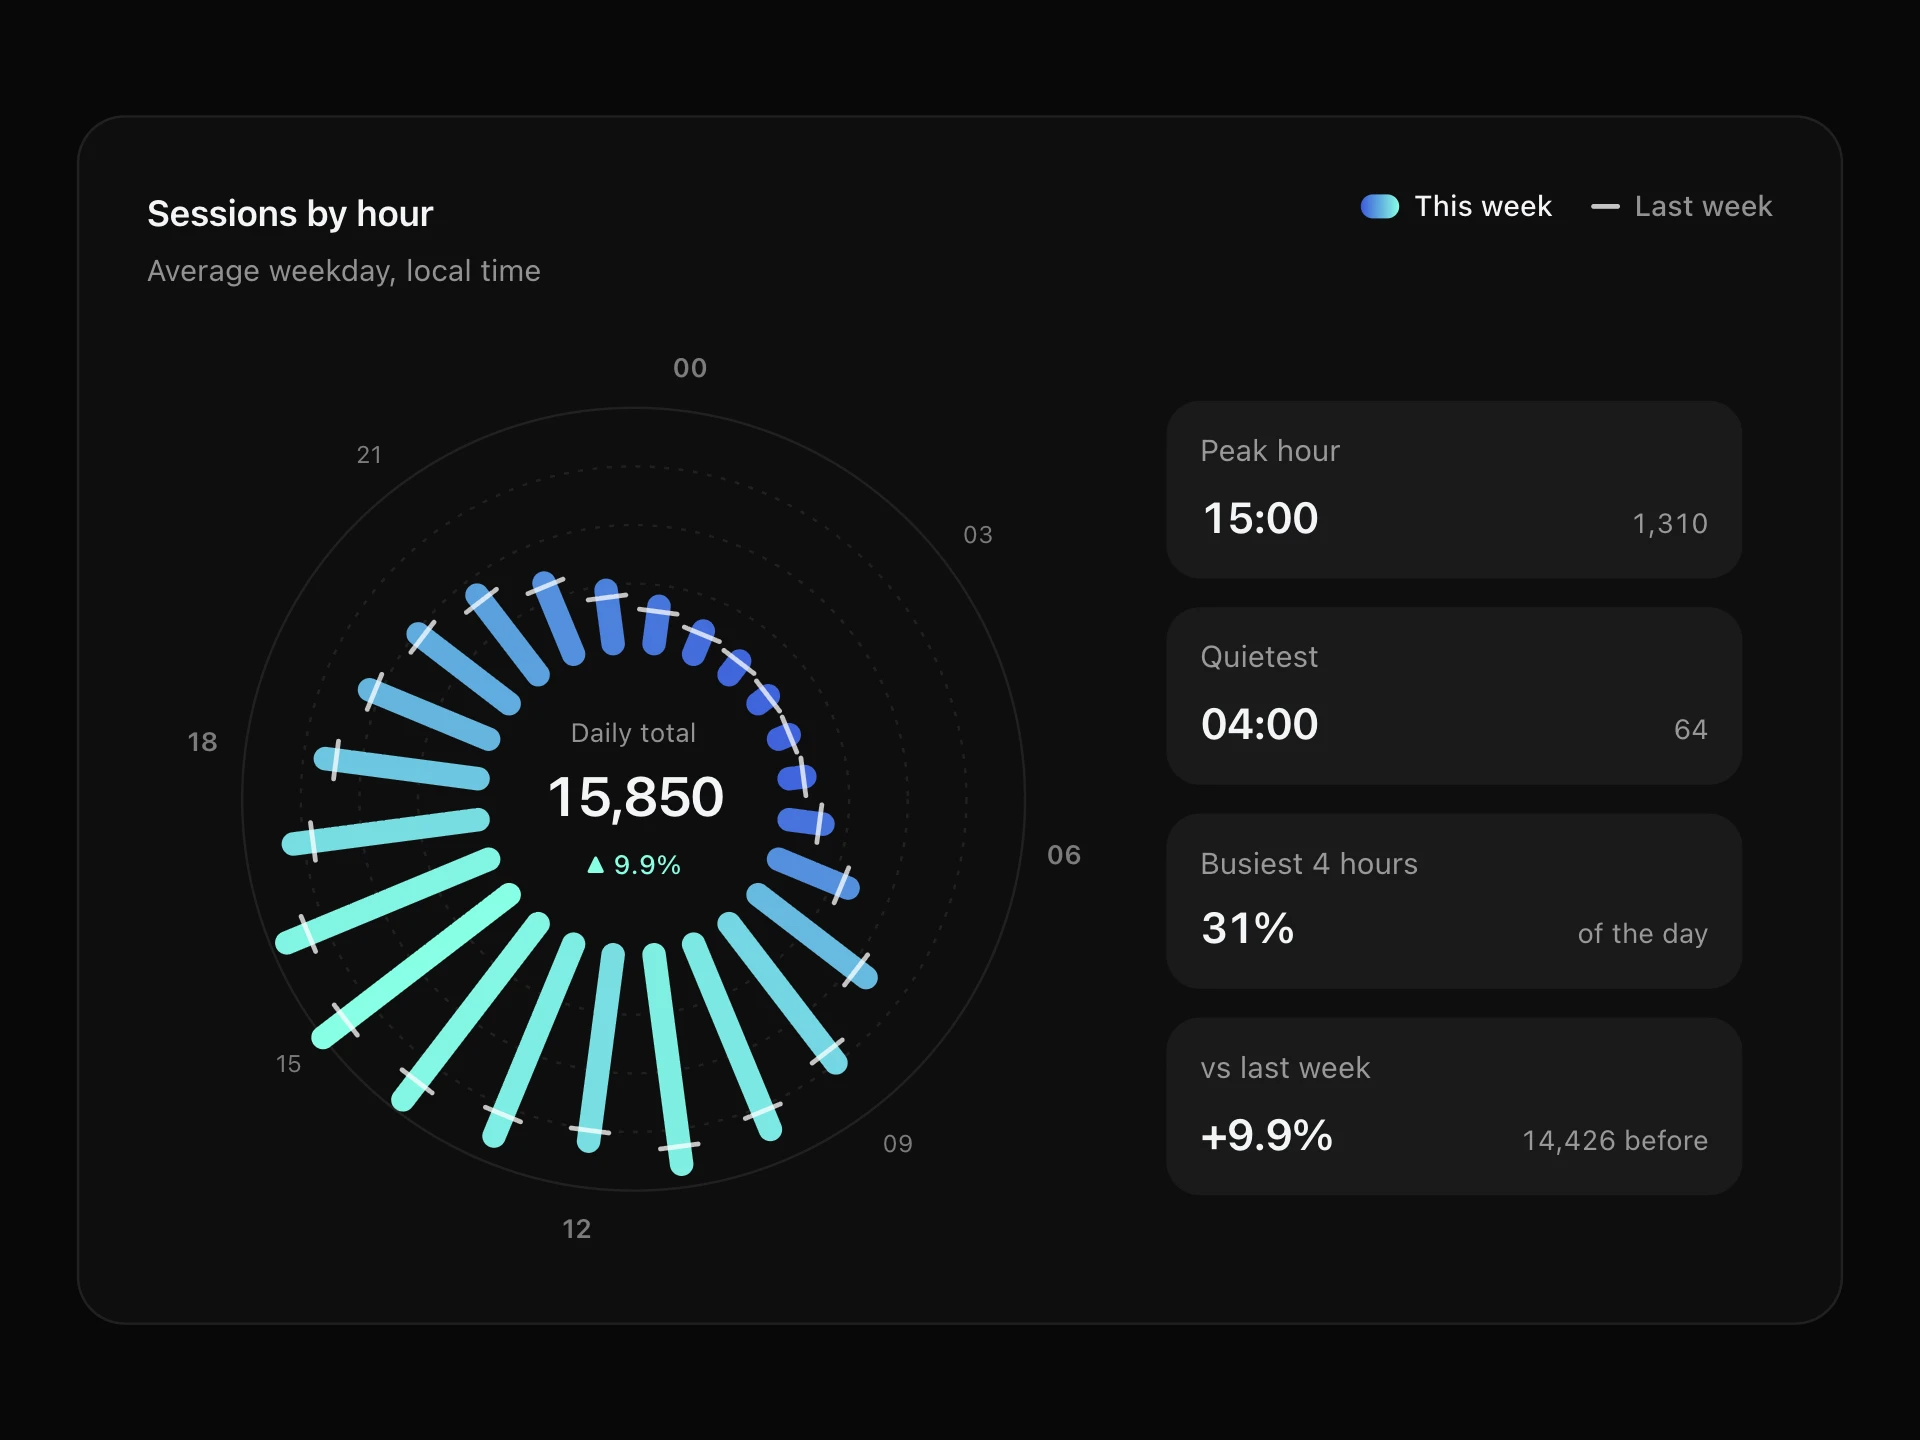
Bullet Chart React component
A bullet chart for goals: one compact row per KPI with poor / fair / good bands, the actual value as a bar, a target line, last quarter's marker and an on-track / at-risk / behind status, including metrics where lower is better.
About the Bullet Chart component
Bullet Chart packs a goal into one compact row: background bands show poor, fair and good, a bar shows where you are, a line marks the target and a small diamond shows last quarter. Each row ends with the value and a status: on track, at risk or behind.
It handles metrics where less is better, like response time or churn, by flipping the bands and the status. Hover, tap or use the arrow keys for a row's full numbers.
When to use it
Use it for OKR and goal dashboards, sales targets, SLA and support metrics, budgets and quarterly business reviews: anywhere several KPIs each have a target.
It replaces gauges and dials with something that takes a fraction of the space and is easier to compare.
Installation
Add the Bullet Chart component to your project with the shadcn CLI. It lands in components/bullet-chart.tsx as plain React + Tailwind CSS source you own and can edit.
npx shadcn@latest add @reactframe/bullet-chartOr copy the source by hand and install its dependencies:
npm install clsx tailwind-mergeProps
<BulletChart /> accepts 5 props, all optional. It also accepts the usual <div> attributes, like className, style, id and aria-*, and passes them to its root element.
| Prop | Type | Default |
|---|---|---|
| theme | "dark" | "light" | "dark" |
| title | string | "Quarterly goals" |
| subtitle | string | "Q3 2025, as of week 9 of 13" |
| items | BulletItem[] | DEFAULT_ITEMS |
| color Colour of the measure bars. | string | — |
- theme"dark" | "light"Default: "dark"
- titlestringDefault: "Quarterly goals"
- subtitlestringDefault: "Q3 2025, as of week 9 of 13"
- itemsBulletItem[]Default: DEFAULT_ITEMS
- color
Colour of the measure bars.
string
npm dependencies
Installed for you by the shadcn CLI.
Bullet Chart FAQ
- What does each item need?
- label, value, target and ranges: the upper bounds of the poor, fair and good bands (the last one is where the scale ends). sub, previous, lowerIsBetter and format are optional.
- How is the status decided?
- From the share of target reached: 100% or more is on track, 90–99% is at risk, below 90% is behind. For lowerIsBetter metrics it uses target ÷ value instead.
- Can I format each metric differently?
- Yes, every item takes its own format function, so currency, counts, percentages and minutes can sit in one chart.
- What happens on small screens?
- Below 560px wide the bullet moves under the label and value, using the full width of the card.