Neon Pulse Line Chart React component
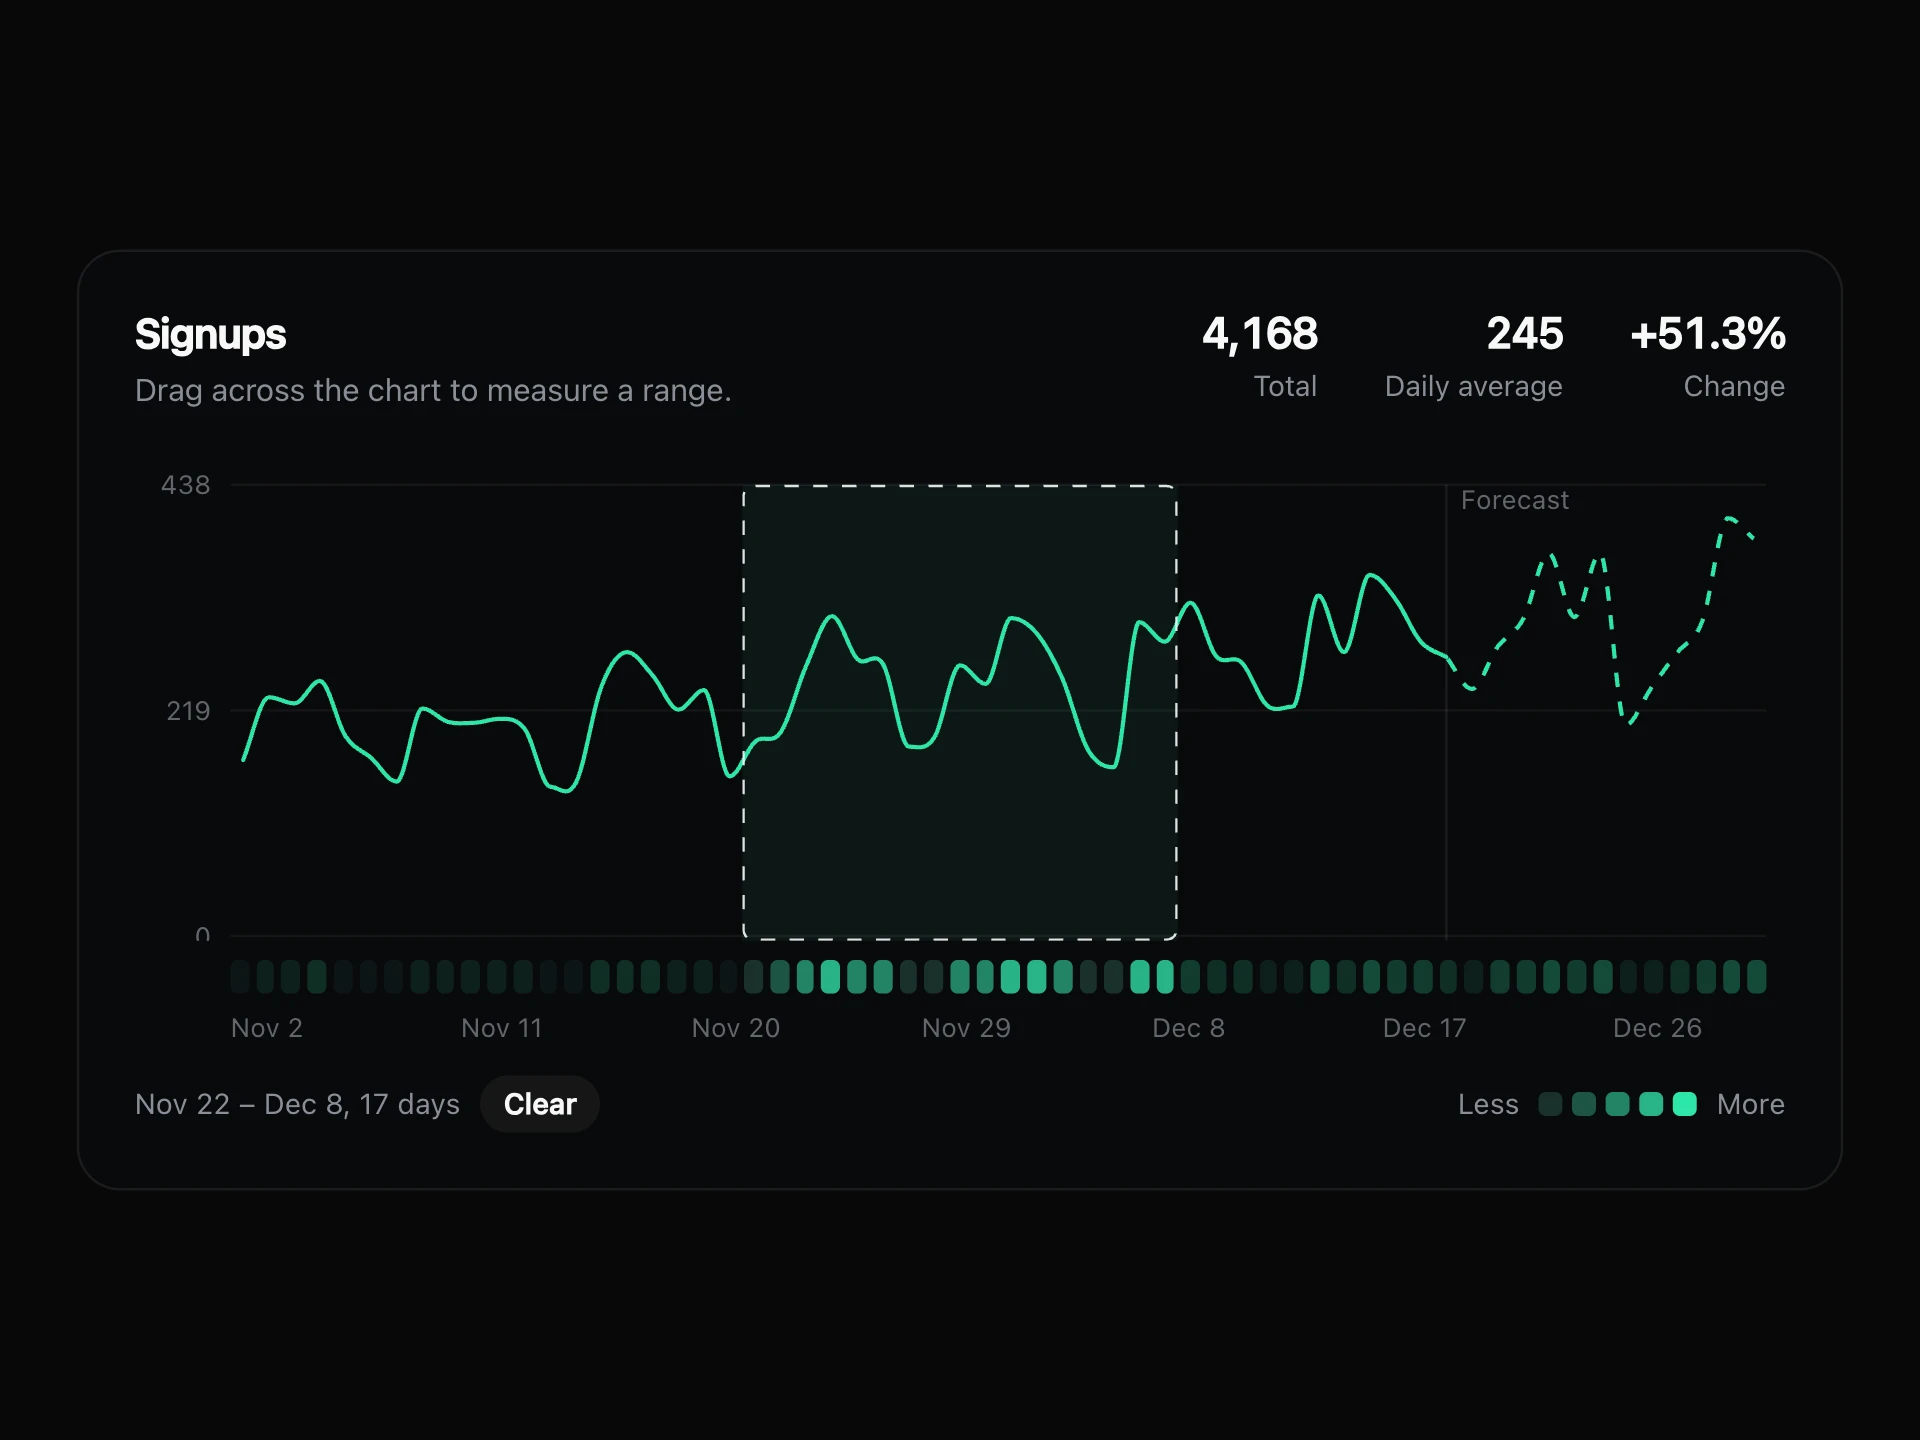
A calm line with a bright pulse travelling along it, lighting up a row of heat cells as it passes. Three stats, a one-line readout and keyboard day inspection.
About the Neon Pulse Line Chart component
Neon Pulse Line Chart makes a quiet line feel alive. A bright pulse runs along it every few seconds, and the row of heat cells underneath lights up as it passes, so the chart reads like a signal moving through a system.
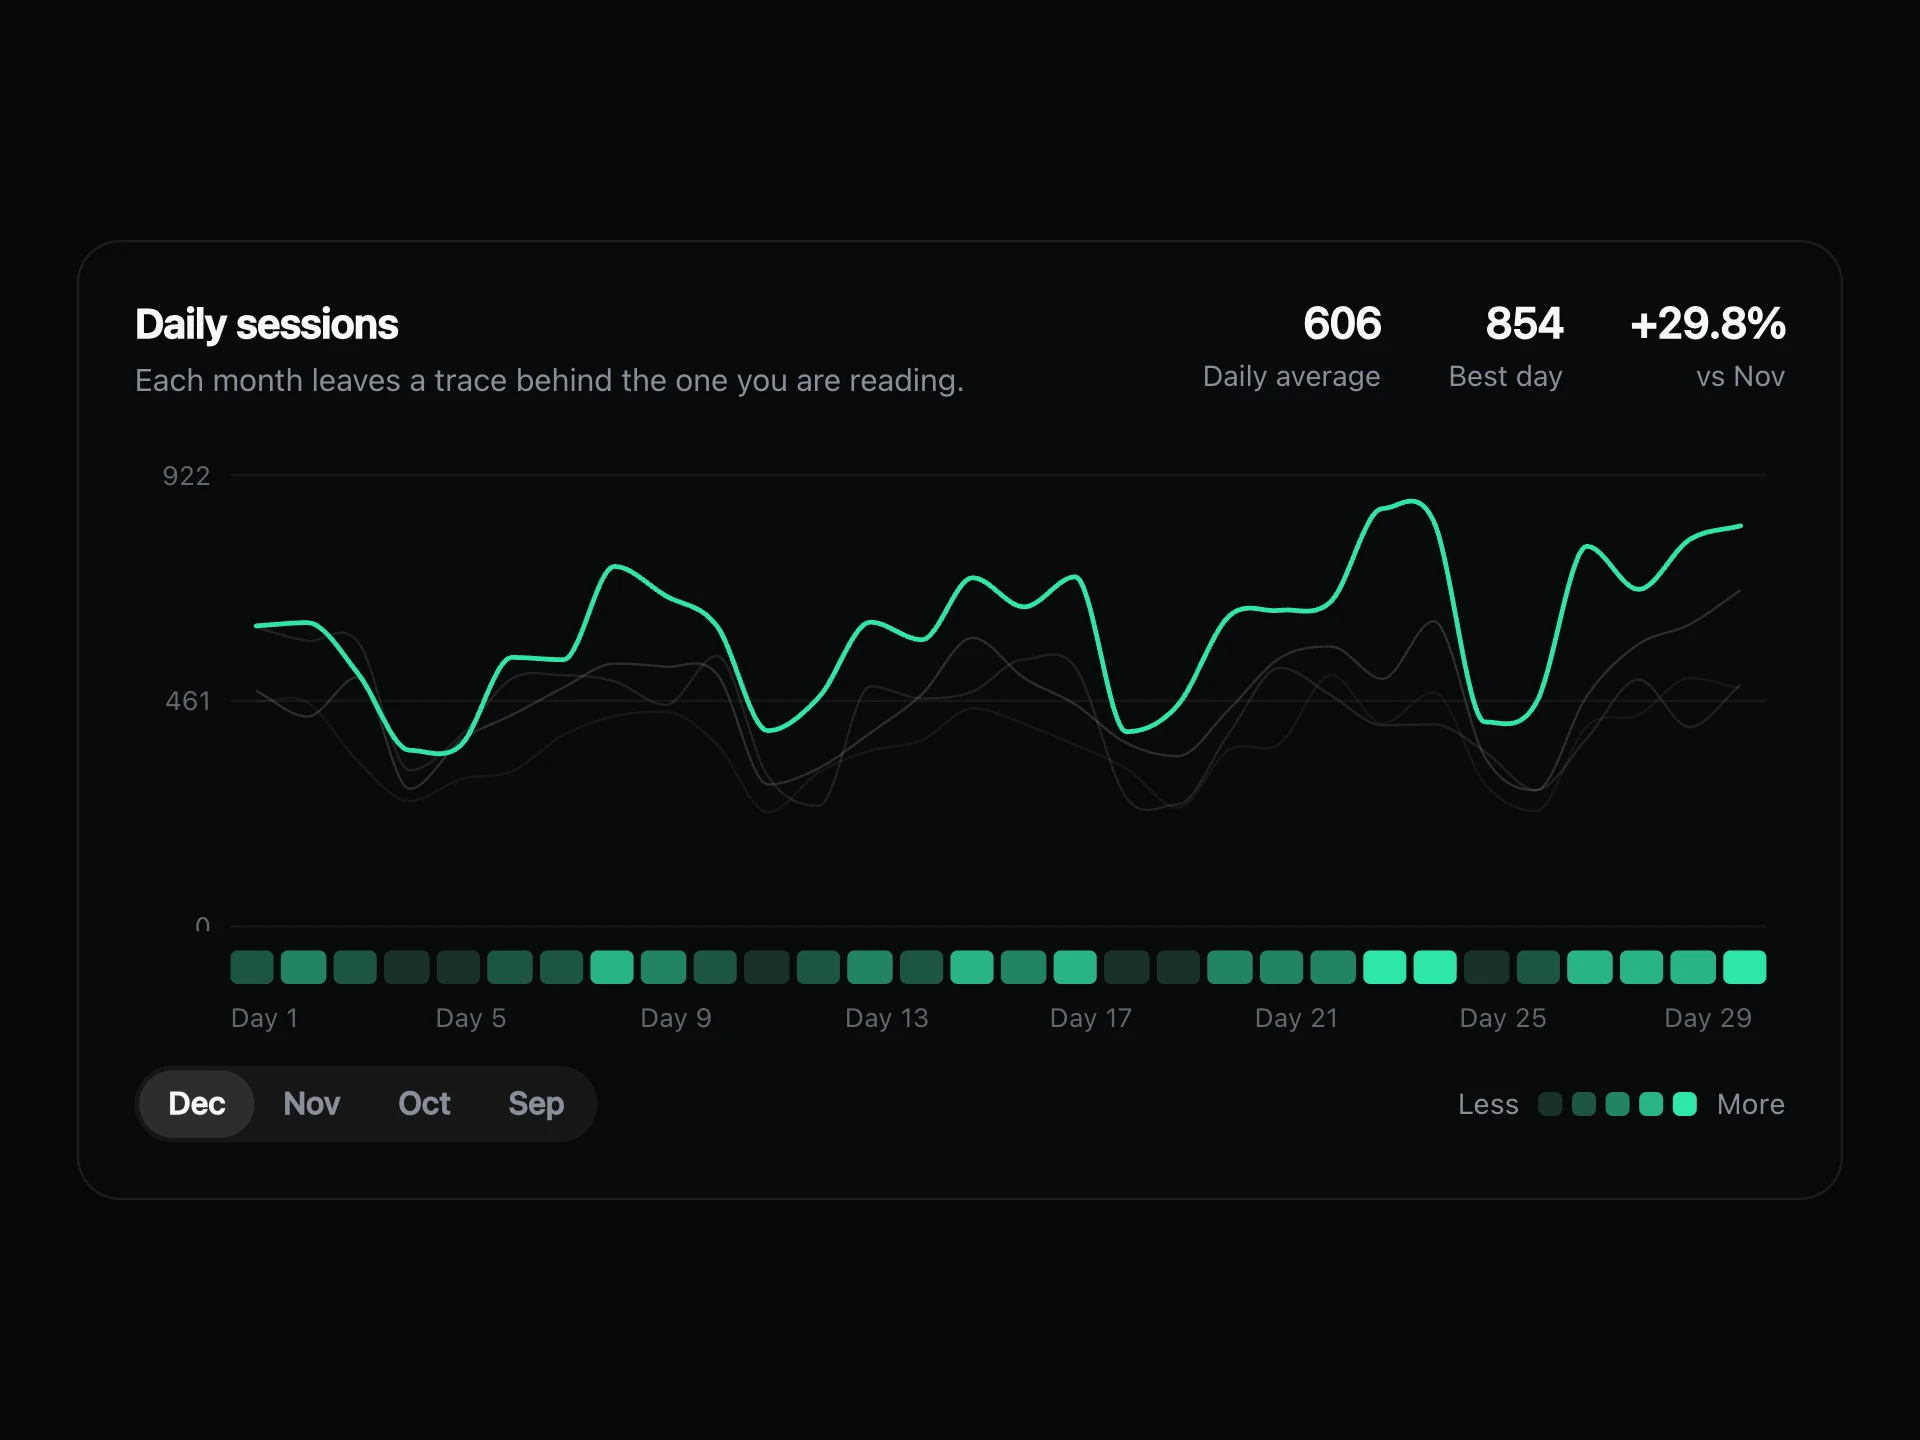
Everything else stays calm: three stats at the top, a one-line readout on hover, and a Less to More legend. The cells give you the shape of the period at a glance, and the line gives you the detail.
When to use it
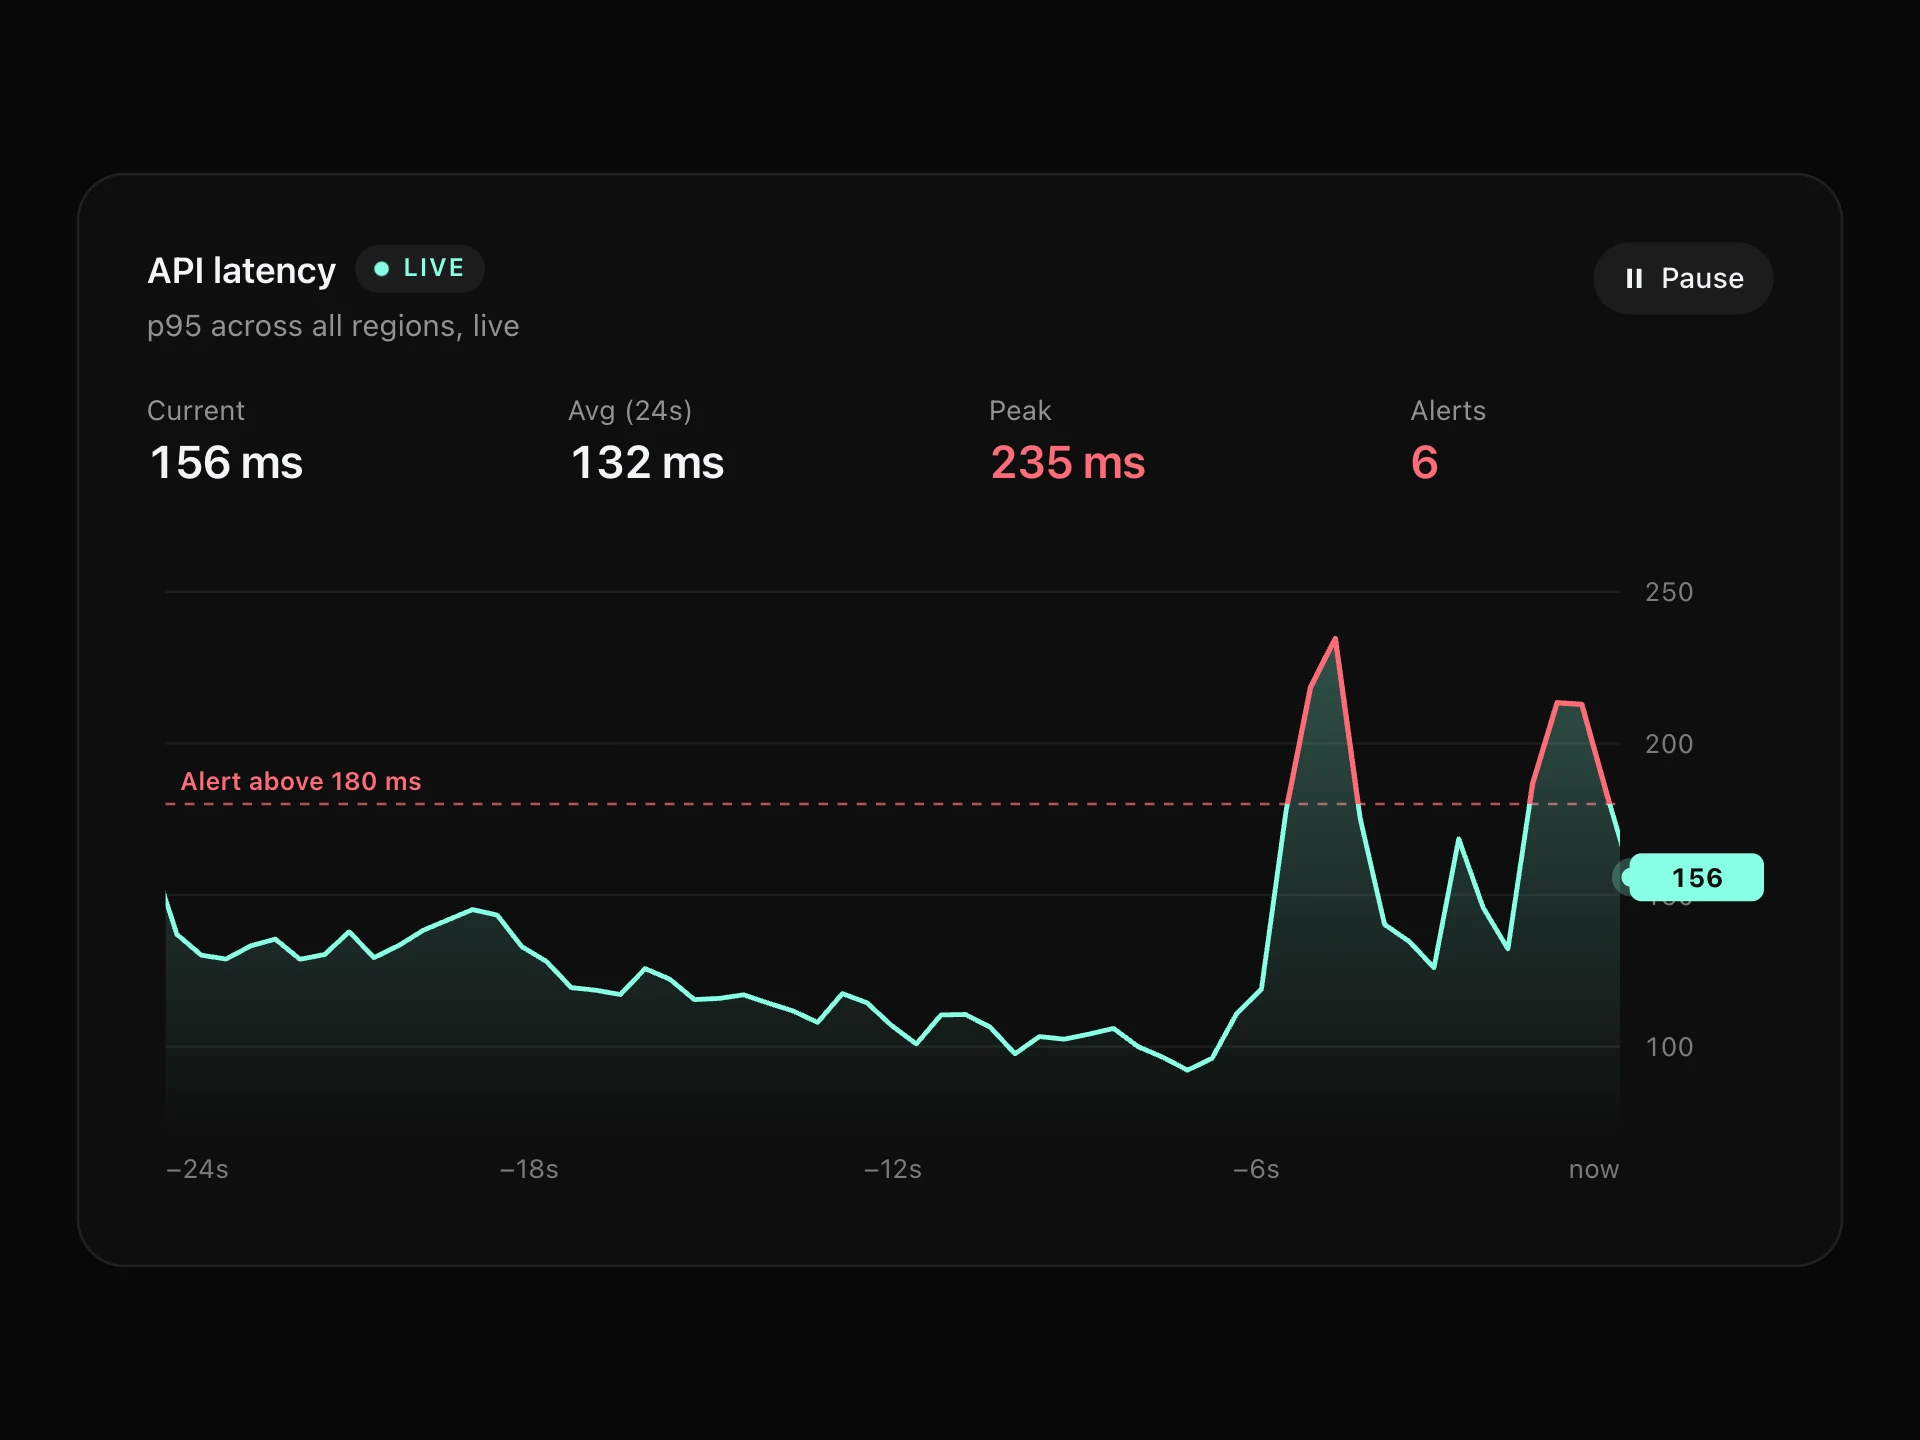
Use it for live-feeling status and traffic panels, like requests, events or throughput, where a little motion says the system is running.
For a report that will be read rather than watched, a plain line chart is the better choice.
Installation
Add the Neon Pulse Line Chart component to your project with the shadcn CLI. It lands in components/neon-pulse-line-chart.tsx as plain React + Tailwind CSS source you own and can edit.
npx shadcn@latest add @reactframe/neon-pulse-line-chartProps
<NeonPulseLineChart /> accepts 9 props, all optional. It also accepts the usual <section> attributes, like className, style, id and aria-*, and passes them to its root element.
| Prop | Type | Default |
|---|---|---|
| theme | "dark" | "light" | "dark" |
| title | string | "Request pulse" |
| subtitle Line under the title. Worked out from the data when left out. | string | — |
| data | { date: string; value: number }[] | DEFAULT_DATA |
| color Colour of the line, pulse and cells. | string | — |
| pulseSeconds Seconds between pulses. | number | 3.2 |
| height Height of the plot, in px. | number | 200 |
| unit Word after the value in the readout. | string | "req/s" |
| formatValue | (value: number) => string | FORMAT |
- theme"dark" | "light"Default: "dark"
- titlestringDefault: "Request pulse"
- subtitle
Line under the title. Worked out from the data when left out.
string - data{ date: string; value: number }[]Default: DEFAULT_DATA
- color
Colour of the line, pulse and cells.
string - pulseSeconds
Seconds between pulses.
numberDefault: 3.2 - height
Height of the plot, in px.
numberDefault: 200 - unit
Word after the value in the readout.
stringDefault: "req/s" - formatValue(value: number) => stringDefault: FORMAT
Neon Pulse Line Chart FAQ
- Can I change how often it pulses?
- Yes. pulseSeconds sets the time between pulses. The default is 3.2 seconds.
- Does the pulse keep running off screen?
- No. The loop stops when the chart leaves the screen, and it writes straight to the elements, so React does not re-render for it.
- What happens with reduced motion?
- The pulse is left out and the chart stays still. The readout and keyboard control still work.
- How are the cell colours chosen?
- From quartiles of your data, so one huge day does not wash out all the others.