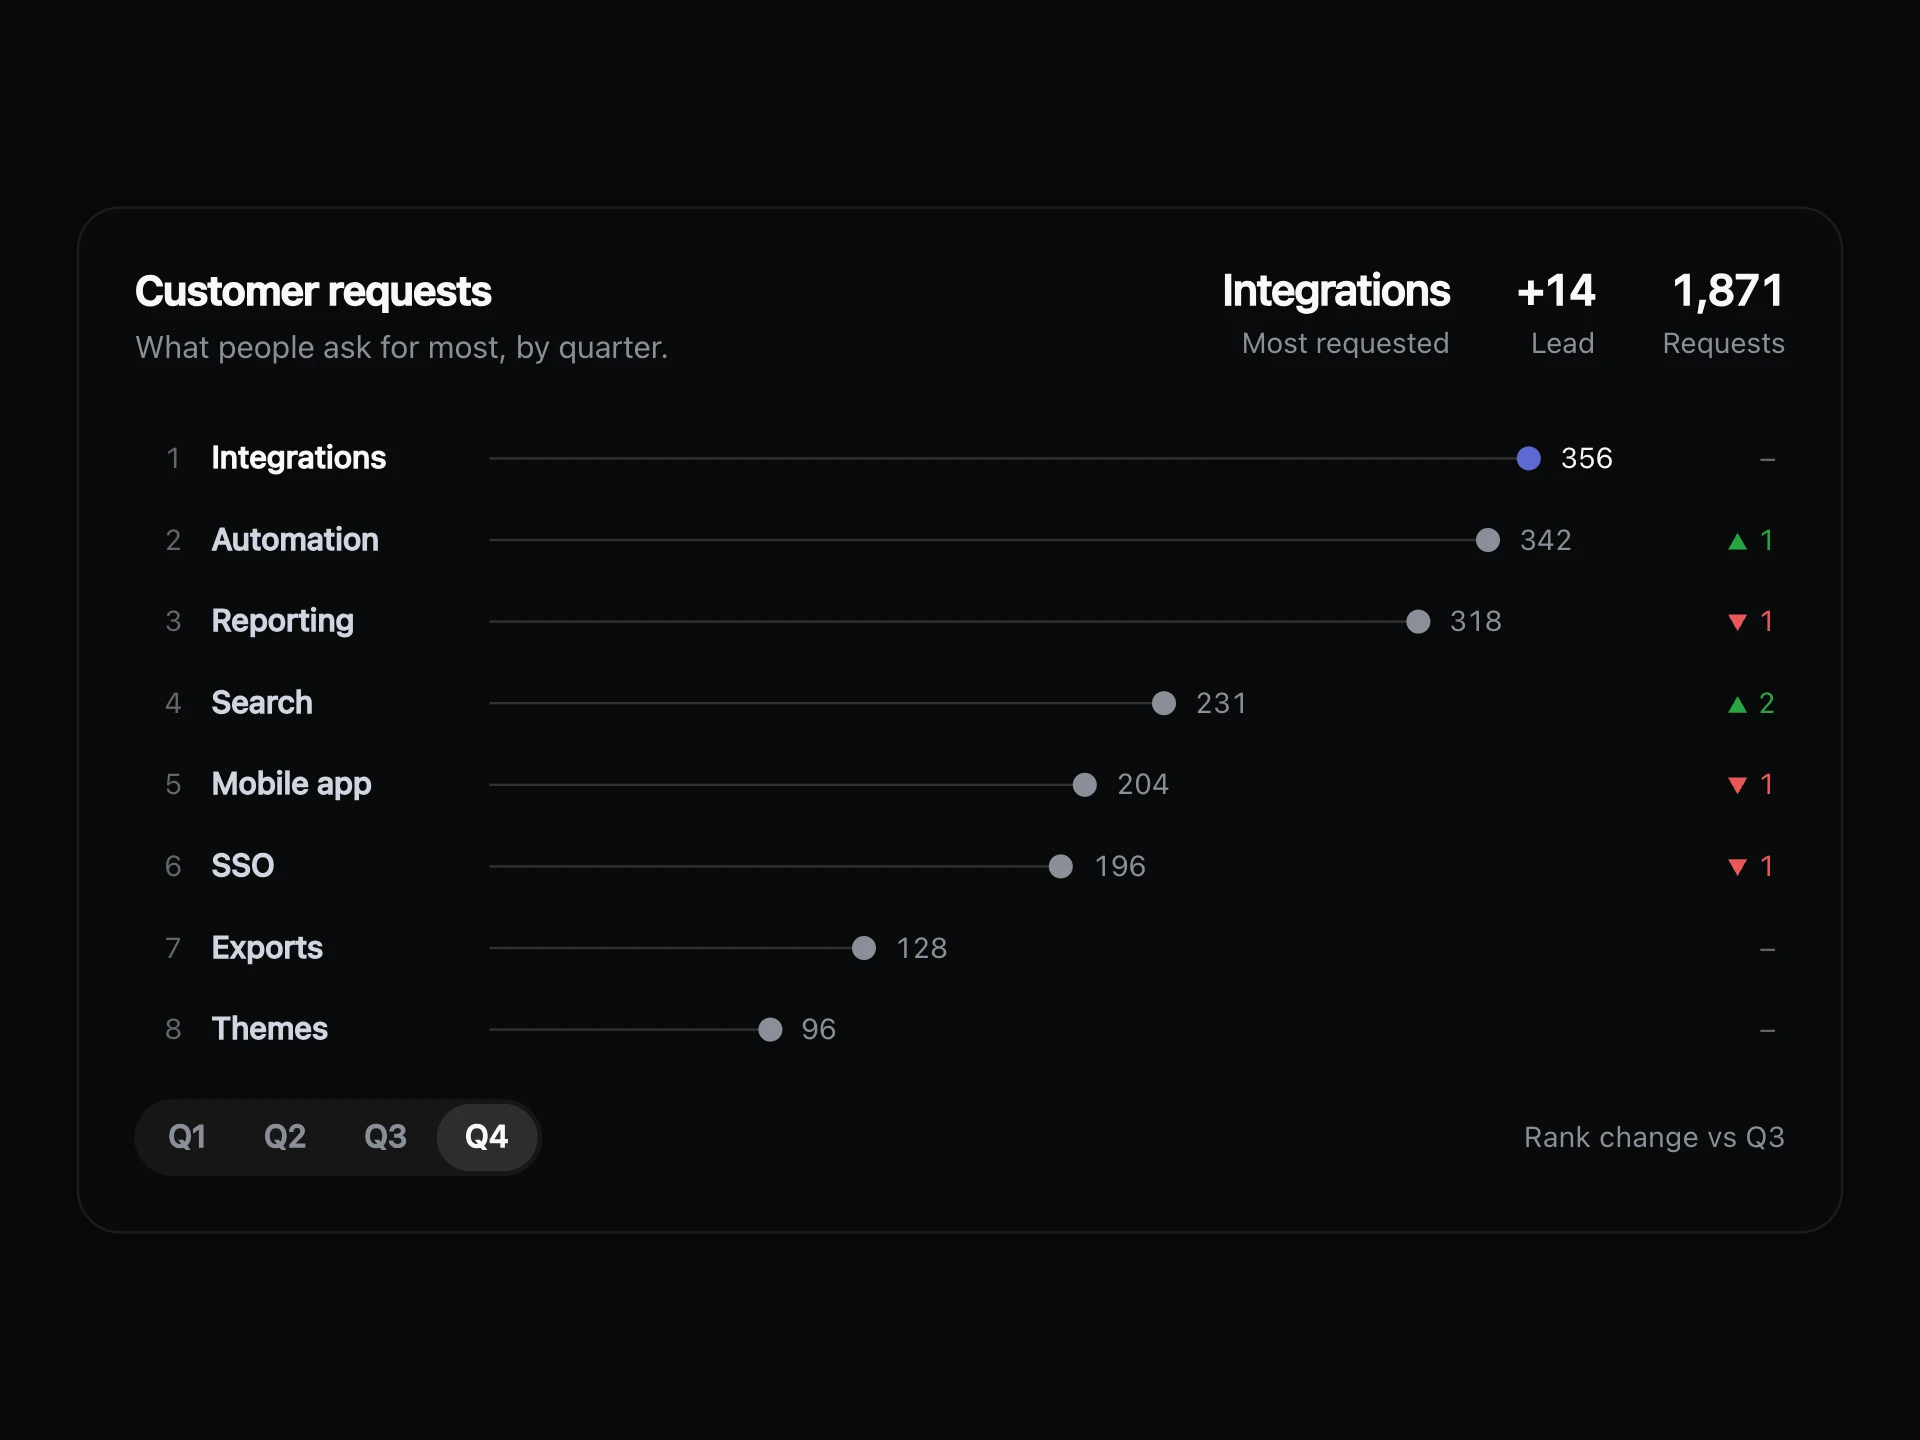
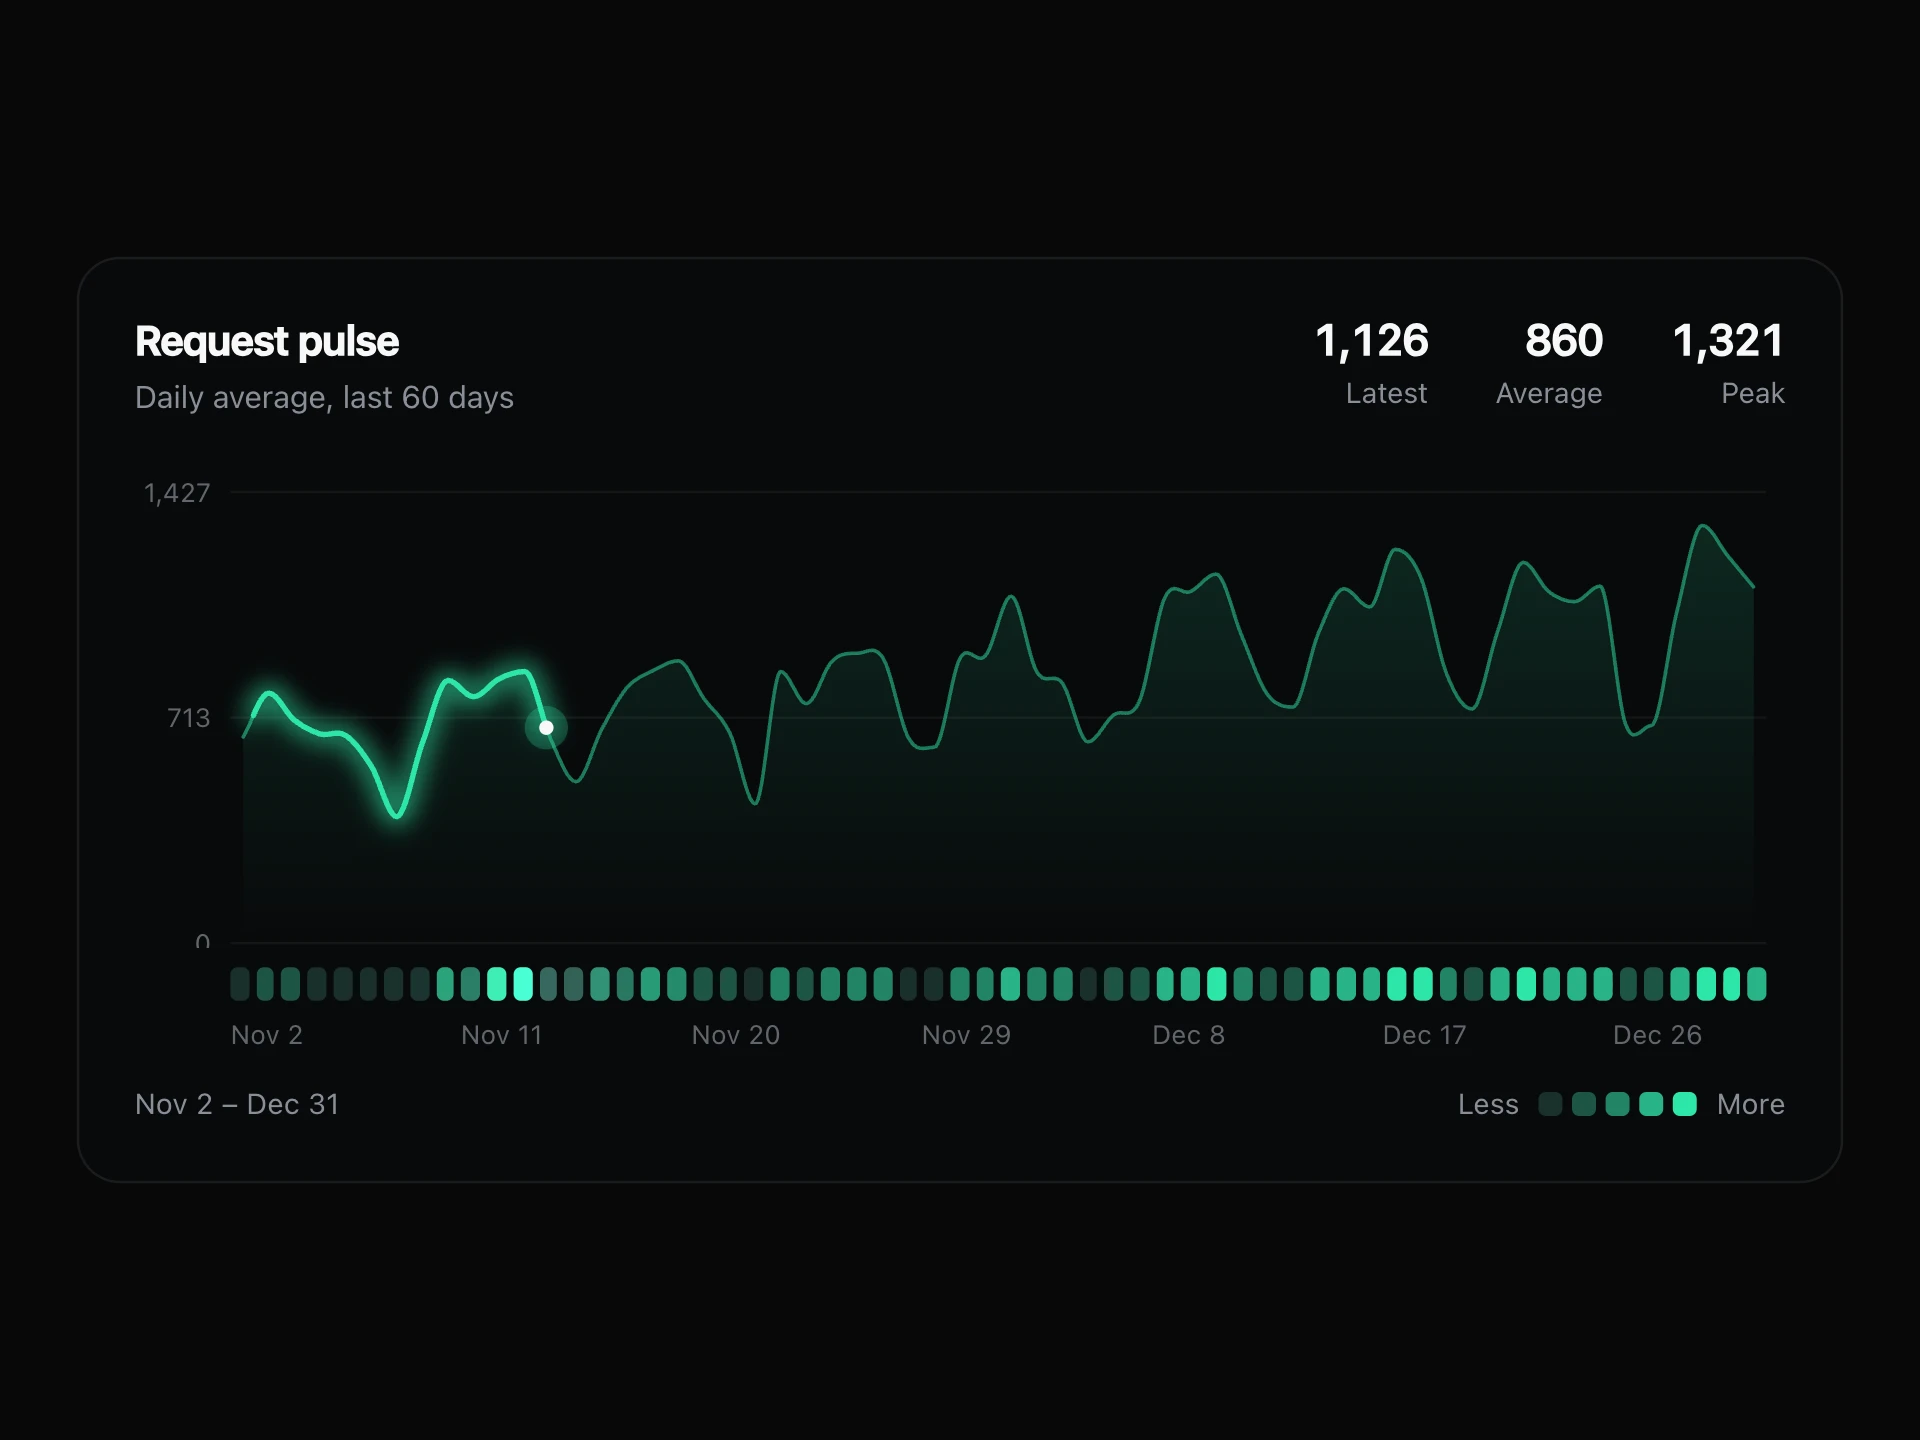
Forecast Ribbon Chart React component
A forecast that shows its doubt: history runs into nested 50, 80 and 95% ribbons that widen with time, and scenarios ease from one shape to the next.
About the Forecast Ribbon Chart component
Forecast Ribbon Chart is honest about what it doesn't know. History runs up to today as a plain line, then the forecast opens into nested ribbons at 50, 80 and 95% confidence that widen the further ahead they look.
Switching scenario eases the line and ribbons to their new shape, and the axis stays put so you can see the difference. Hovering any future month gives you its expected value and likely range.
When to use it
Use it for revenue, demand or capacity planning, where a single projected line would promise more certainty than you have.
For reporting on what already happened, a plain line chart is simpler.
Installation
Add the Forecast Ribbon Chart component to your project with the shadcn CLI. It lands in components/forecast-ribbon-chart.tsx as plain React + Tailwind CSS source you own and can edit.
npx shadcn@latest add @reactframe/forecast-ribbon-chartProps
<ForecastRibbonChart /> accepts 11 props, all optional. It also accepts the usual <section> attributes, like className, style, id and aria-*, and passes them to its root element.
| Prop | Type | Default |
|---|---|---|
| theme | "dark" | "light" | "dark" |
| title | string | "Revenue forecast" |
| subtitle | string | "The ribbon widens the further ahead it looks." |
| history | { label: string; value: number }[] | HISTORY |
| future Labels for the forecast steps. Its length sets how far ahead the ribbon runs. | string[] | FUTURE |
| scenarios | { label: string; growth: number; spread: number }[] | SCENARIOS |
| defaultScenario Index of the scenario shown first. | number | 1 |
| color Colour of the line and ribbon. | string | — |
| height Height of the plot, in px. | number | 250 |
| formatValue | (value: number) => string | FORMAT |
| onScenarioChange | (scenario: RibbonScenario) => void | — |
- theme"dark" | "light"Default: "dark"
- titlestringDefault: "Revenue forecast"
- subtitlestringDefault: "The ribbon widens the further ahead it looks."
- history{ label: string; value: number }[]Default: HISTORY
- future
Labels for the forecast steps. Its length sets how far ahead the ribbon runs.
string[]Default: FUTURE - scenarios{ label: string; growth: number; spread: number }[]Default: SCENARIOS
- defaultScenario
Index of the scenario shown first.
numberDefault: 1 - color
Colour of the line and ribbon.
string - height
Height of the plot, in px.
numberDefault: 250 - formatValue(value: number) => stringDefault: FORMAT
- onScenarioChange(scenario: RibbonScenario) => void
Forecast Ribbon Chart FAQ
- How are the ribbons worked out?
- Each scenario sets a growth rate and a spread. The ribbon's half-width grows with the square root of the step, scaled to 50, 80 or 95% confidence.
- Can I use my own forecast numbers?
- Yes, by choosing growth and spread to match, or by editing the two small functions in the file that work out the median and half-width.
- Why doesn't the axis change between scenarios?
- It fits the widest scenario from the start, so a switch shows the forecast moving rather than the scale.
- What happens with reduced motion?
- The ribbon appears at once and scenarios change without easing.