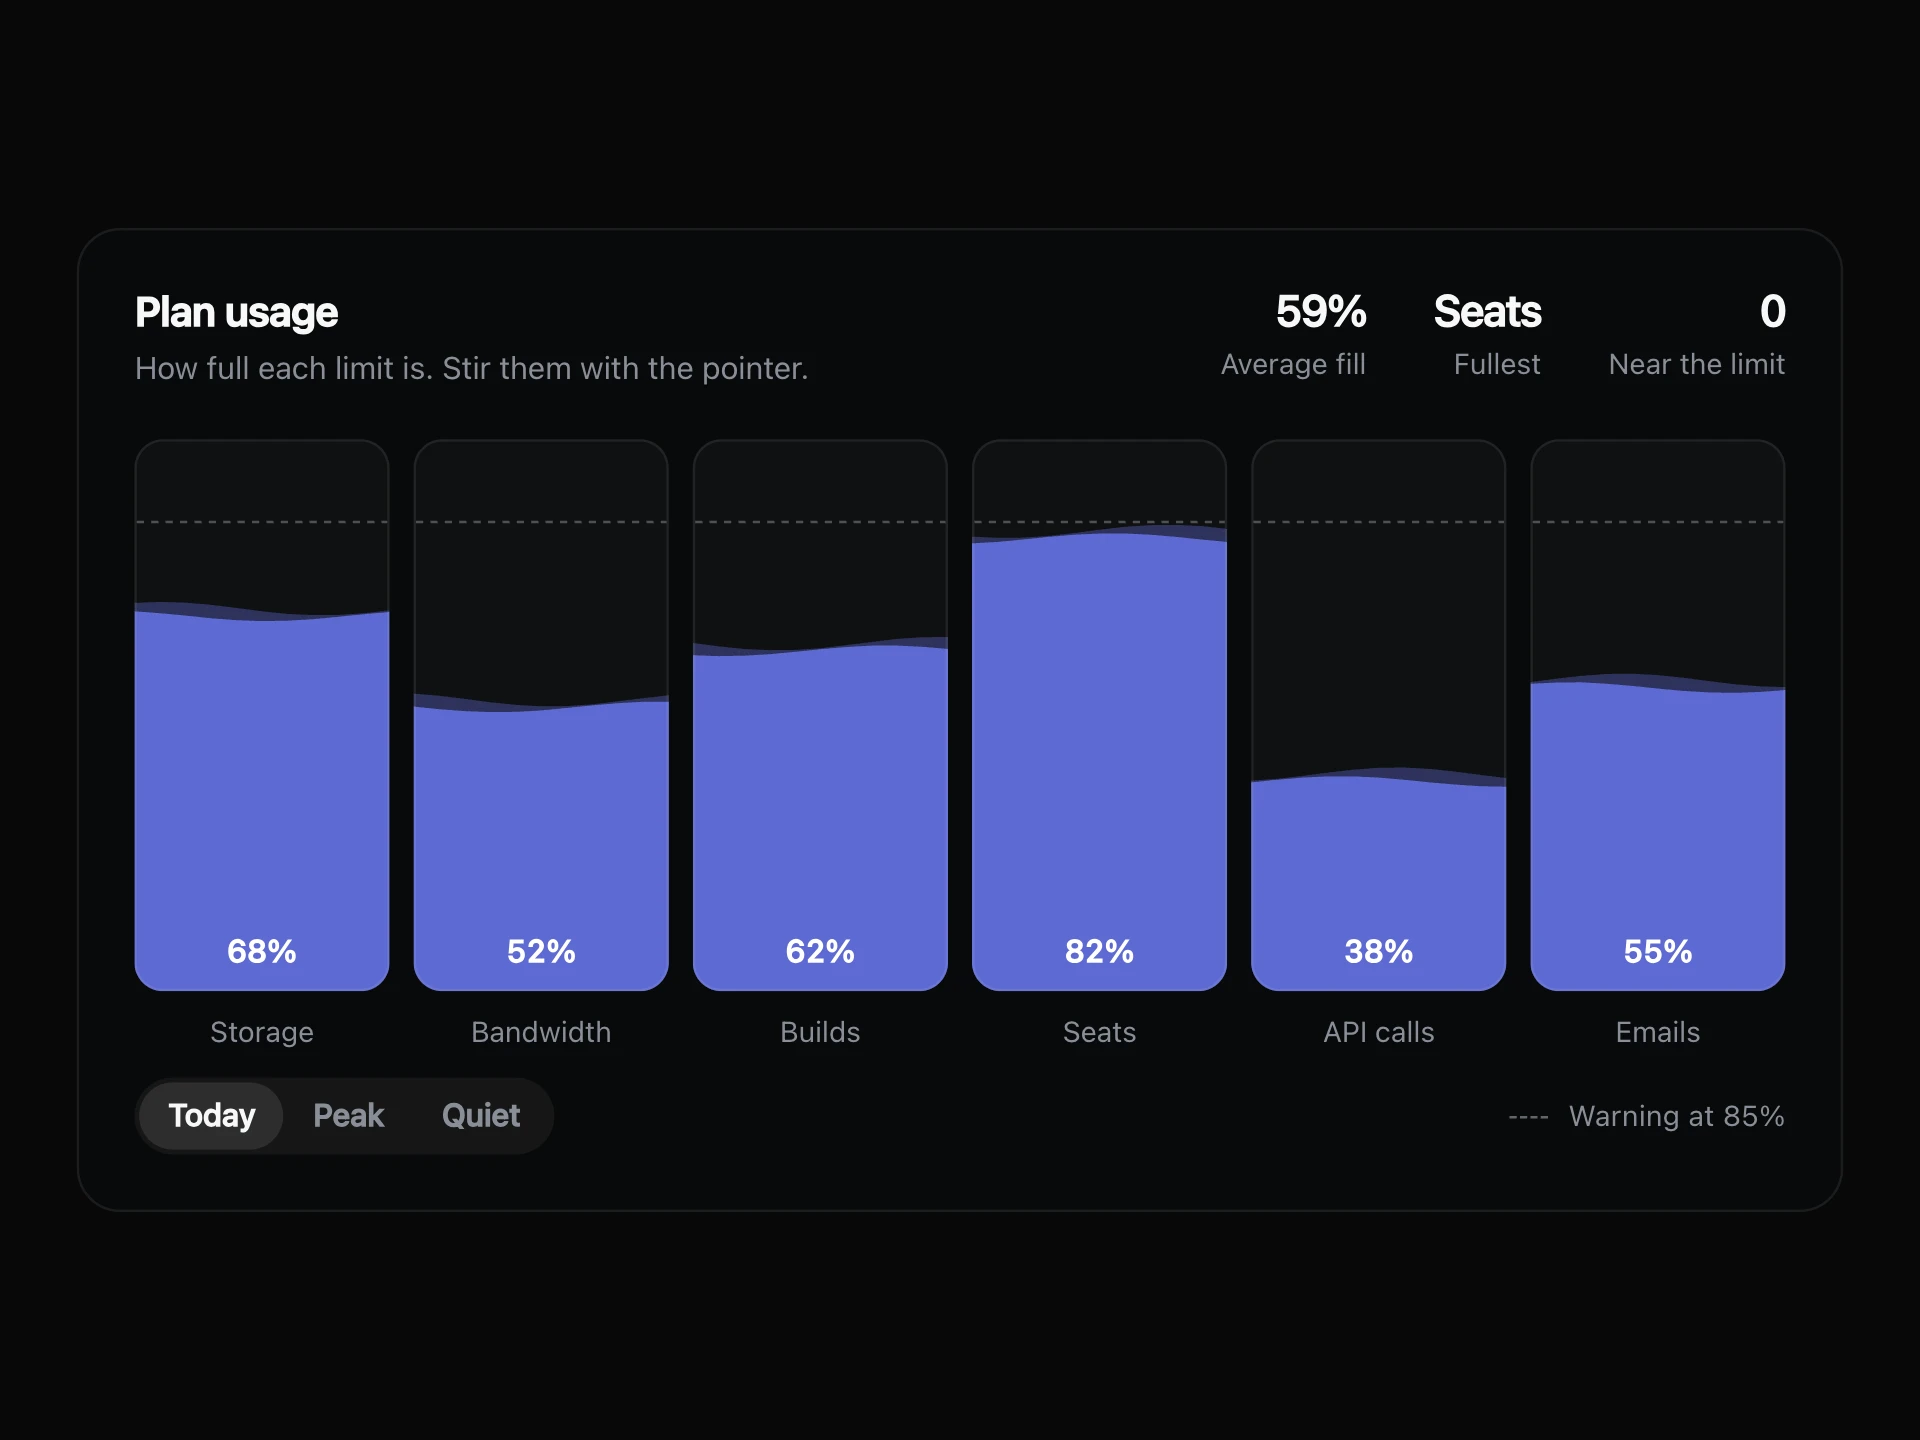
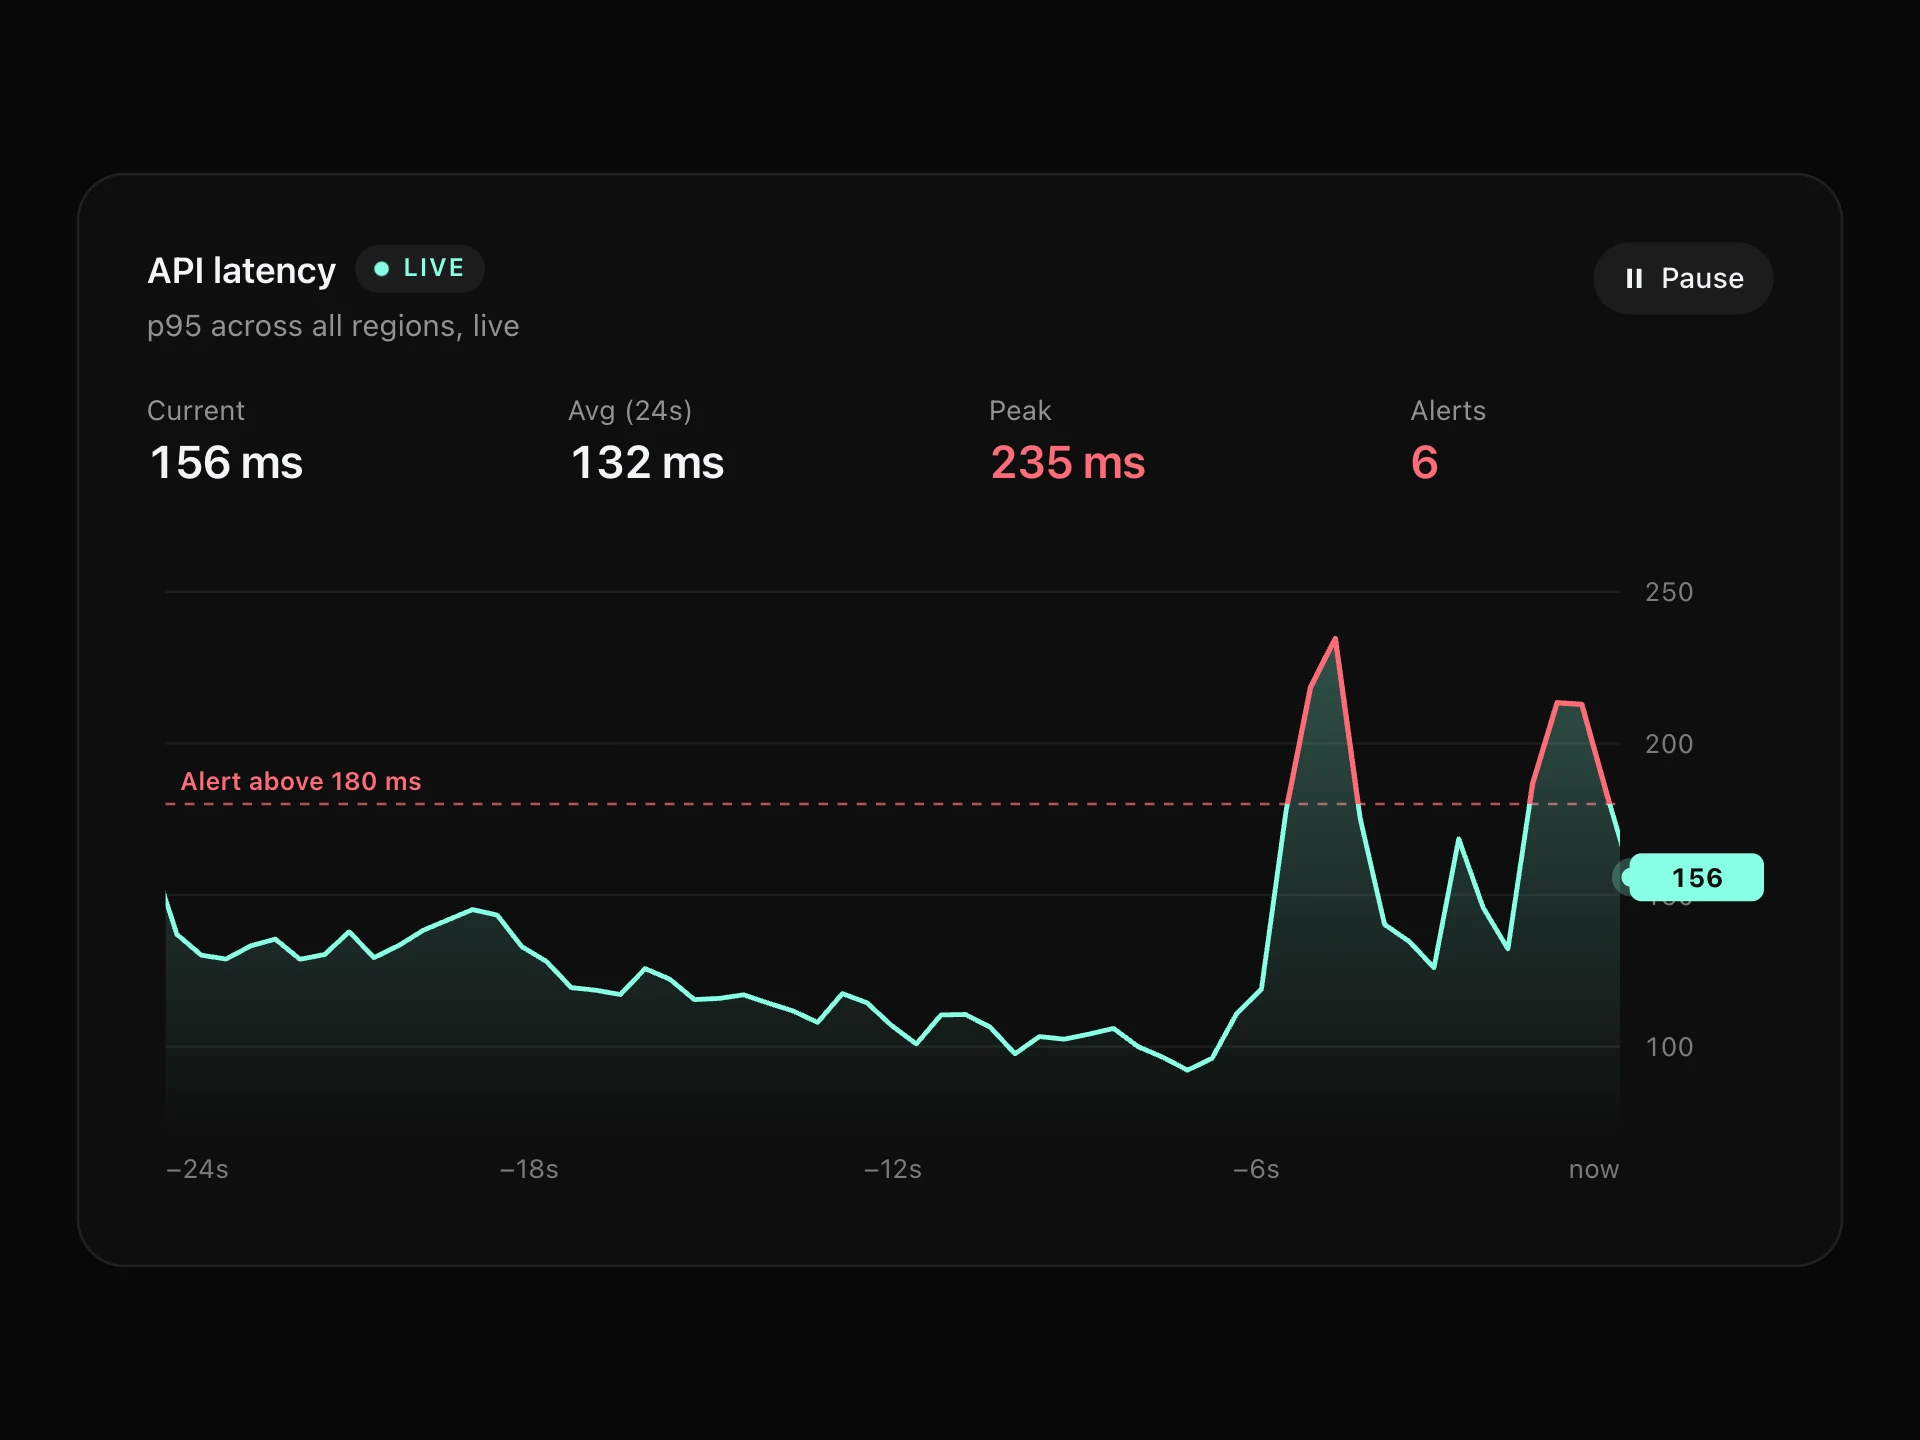
Ghost Trail Line Chart React component
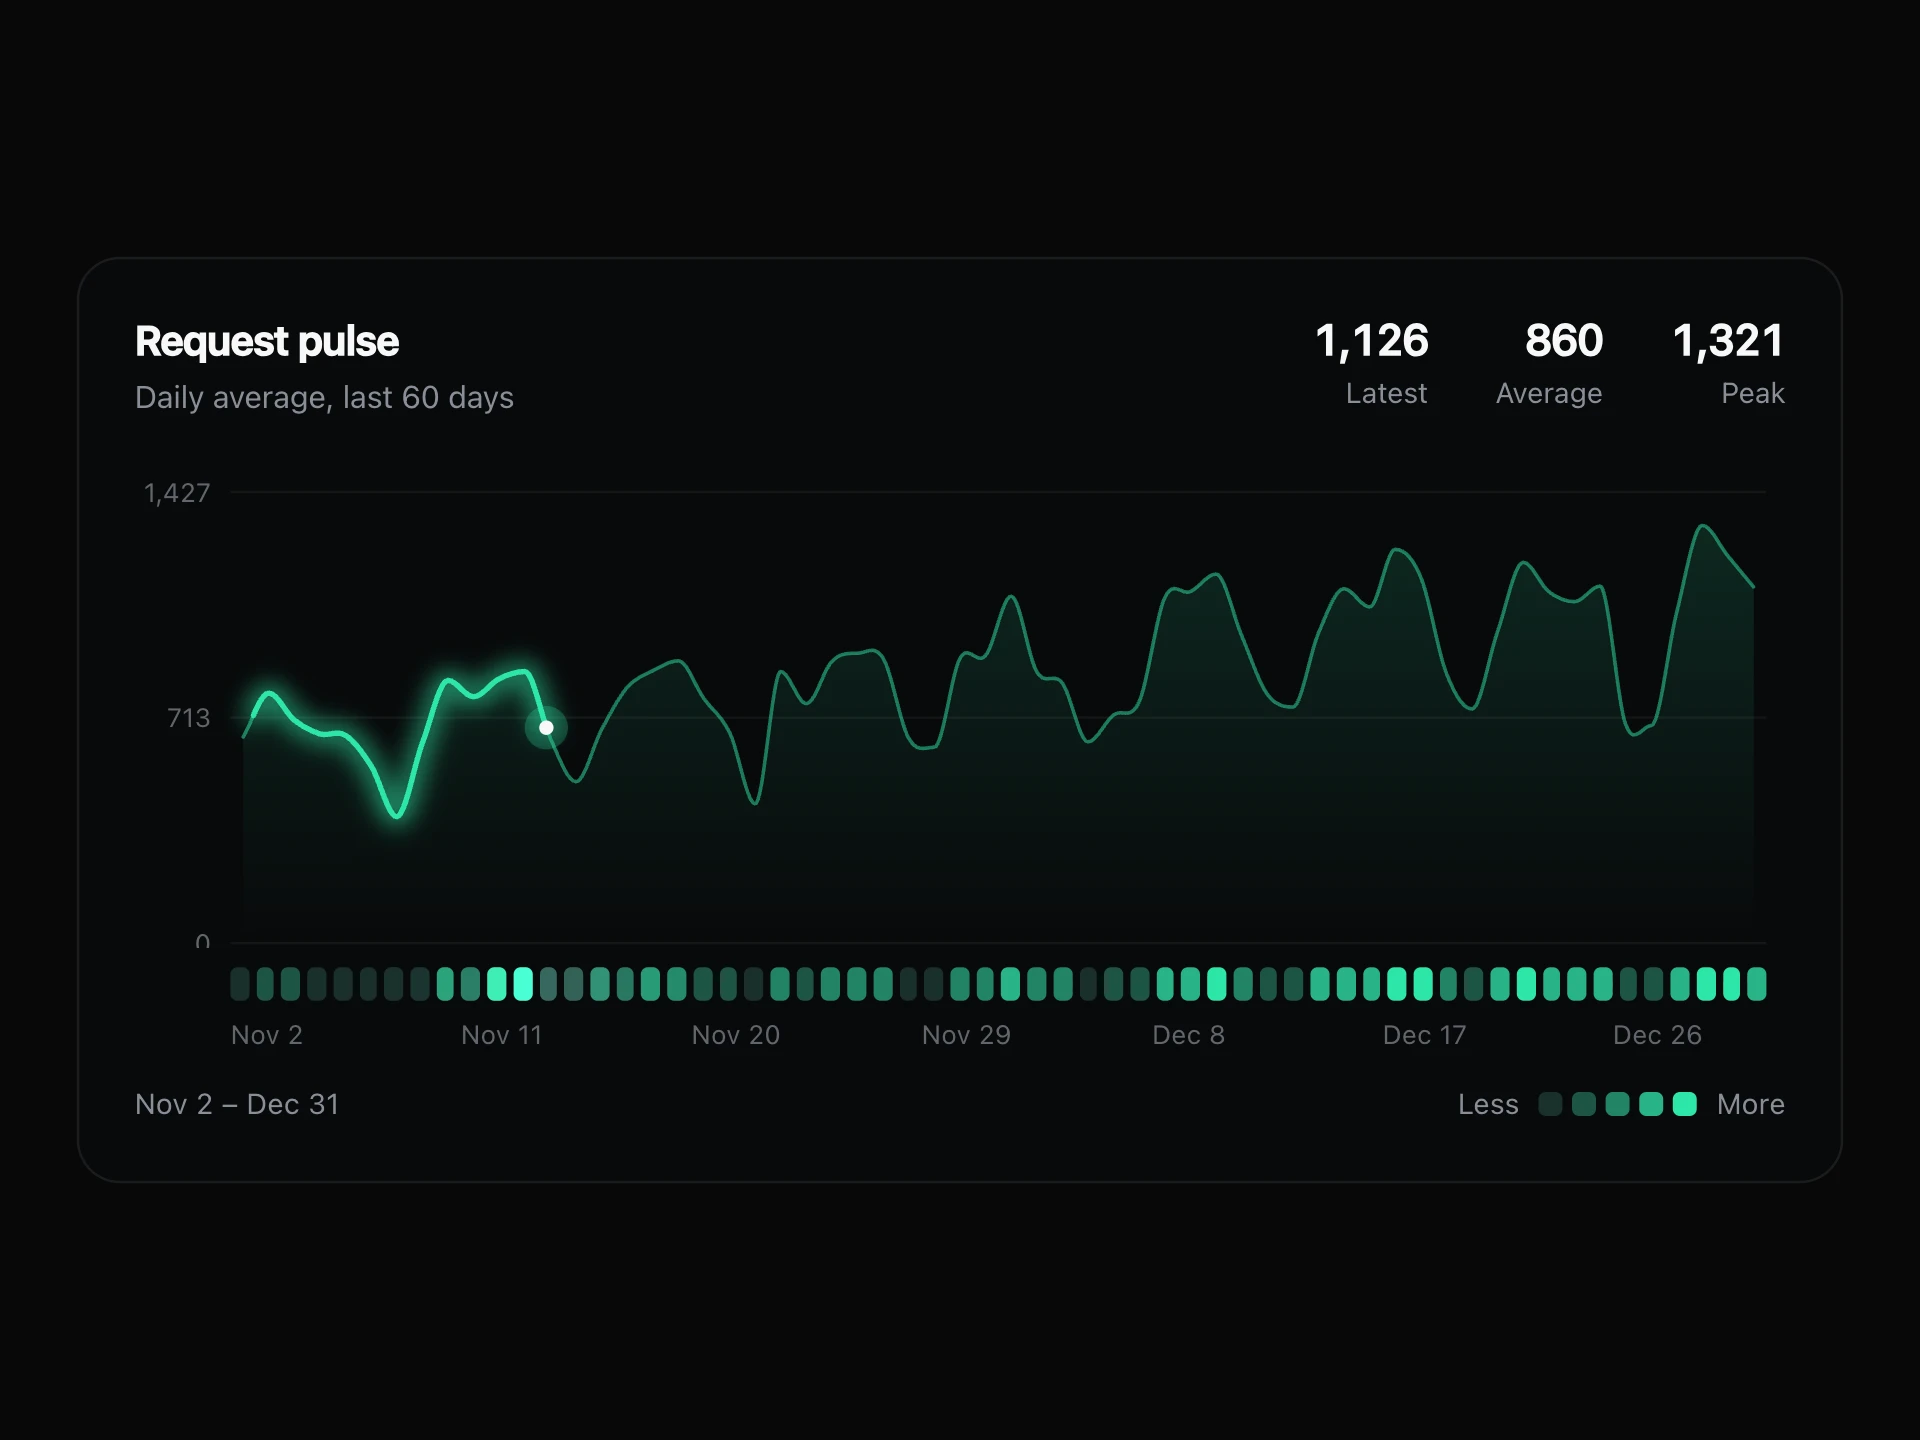
Compare periods by flipping through them: the line swings to its new shape and leaves fading ghosts behind, with earlier periods kept as faint traces.
About the Ghost Trail Line Chart component
Ghost Trail Line Chart compares periods by moving between them. Pick a month and the line swings to its new shape, leaving a trail of fading ghosts behind it, so your eye sees exactly what changed.
The other periods stay behind the line as faint traces, and hovering marks the same day on all of them. The stats give the daily average, the best day and the change against the period before.
When to use it
Use it when the shape of a period matters, like comparing this month with the last few or one release with another.
To compare many series at the same moment, a standard multi-line chart shows them all at full strength.
Installation
Add the Ghost Trail Line Chart component to your project with the shadcn CLI. It lands in components/ghost-trail-line-chart.tsx as plain React + Tailwind CSS source you own and can edit.
npx shadcn@latest add @reactframe/ghost-trail-line-chartProps
<GhostTrailLineChart /> accepts 10 props, all optional. It also accepts the usual <section> attributes, like className, style, id and aria-*, and passes them to its root element.
| Prop | Type | Default |
|---|---|---|
| theme | "dark" | "light" | "dark" |
| title | string | "Daily sessions" |
| subtitle | string | "Each month leaves a trace behind the one you are reading." |
| periods Newest first. The others stay behind the line as faint traces. | { label: string; values: number[] }[] | DEFAULT_PERIODS |
| defaultIndex Index of the period shown first. | number | 0 |
| color Colour of the line and cells. | string | — |
| height Height of the plot, in px. | number | 200 |
| unit Word after the value in the readout. | string | "sessions" |
| formatValue | (value: number) => string | FORMAT |
| onPeriodChange | (period: GhostPeriod) => void | — |
- theme"dark" | "light"Default: "dark"
- titlestringDefault: "Daily sessions"
- subtitlestringDefault: "Each month leaves a trace behind the one you are reading."
- periods
Newest first. The others stay behind the line as faint traces.
{ label: string; values: number[] }[]Default: DEFAULT_PERIODS - defaultIndex
Index of the period shown first.
numberDefault: 0 - color
Colour of the line and cells.
string - height
Height of the plot, in px.
numberDefault: 200 - unit
Word after the value in the readout.
stringDefault: "sessions" - formatValue(value: number) => stringDefault: FORMAT
- onPeriodChange(period: GhostPeriod) => void
Ghost Trail Line Chart FAQ
- What order do the periods go in?
- Newest first. The change stat compares each period with the one after it in the list.
- Can periods have different lengths?
- Yes. Shorter ones hold their last value to the end of the chart, and the stats only count their own days.
- What happens with reduced motion?
- The line changes at once, with no trail. The traces and readout still work.
- Can I react to the period changing?
- Yes. onPeriodChange gives you the period that was picked.