Realtime Line Chart React component
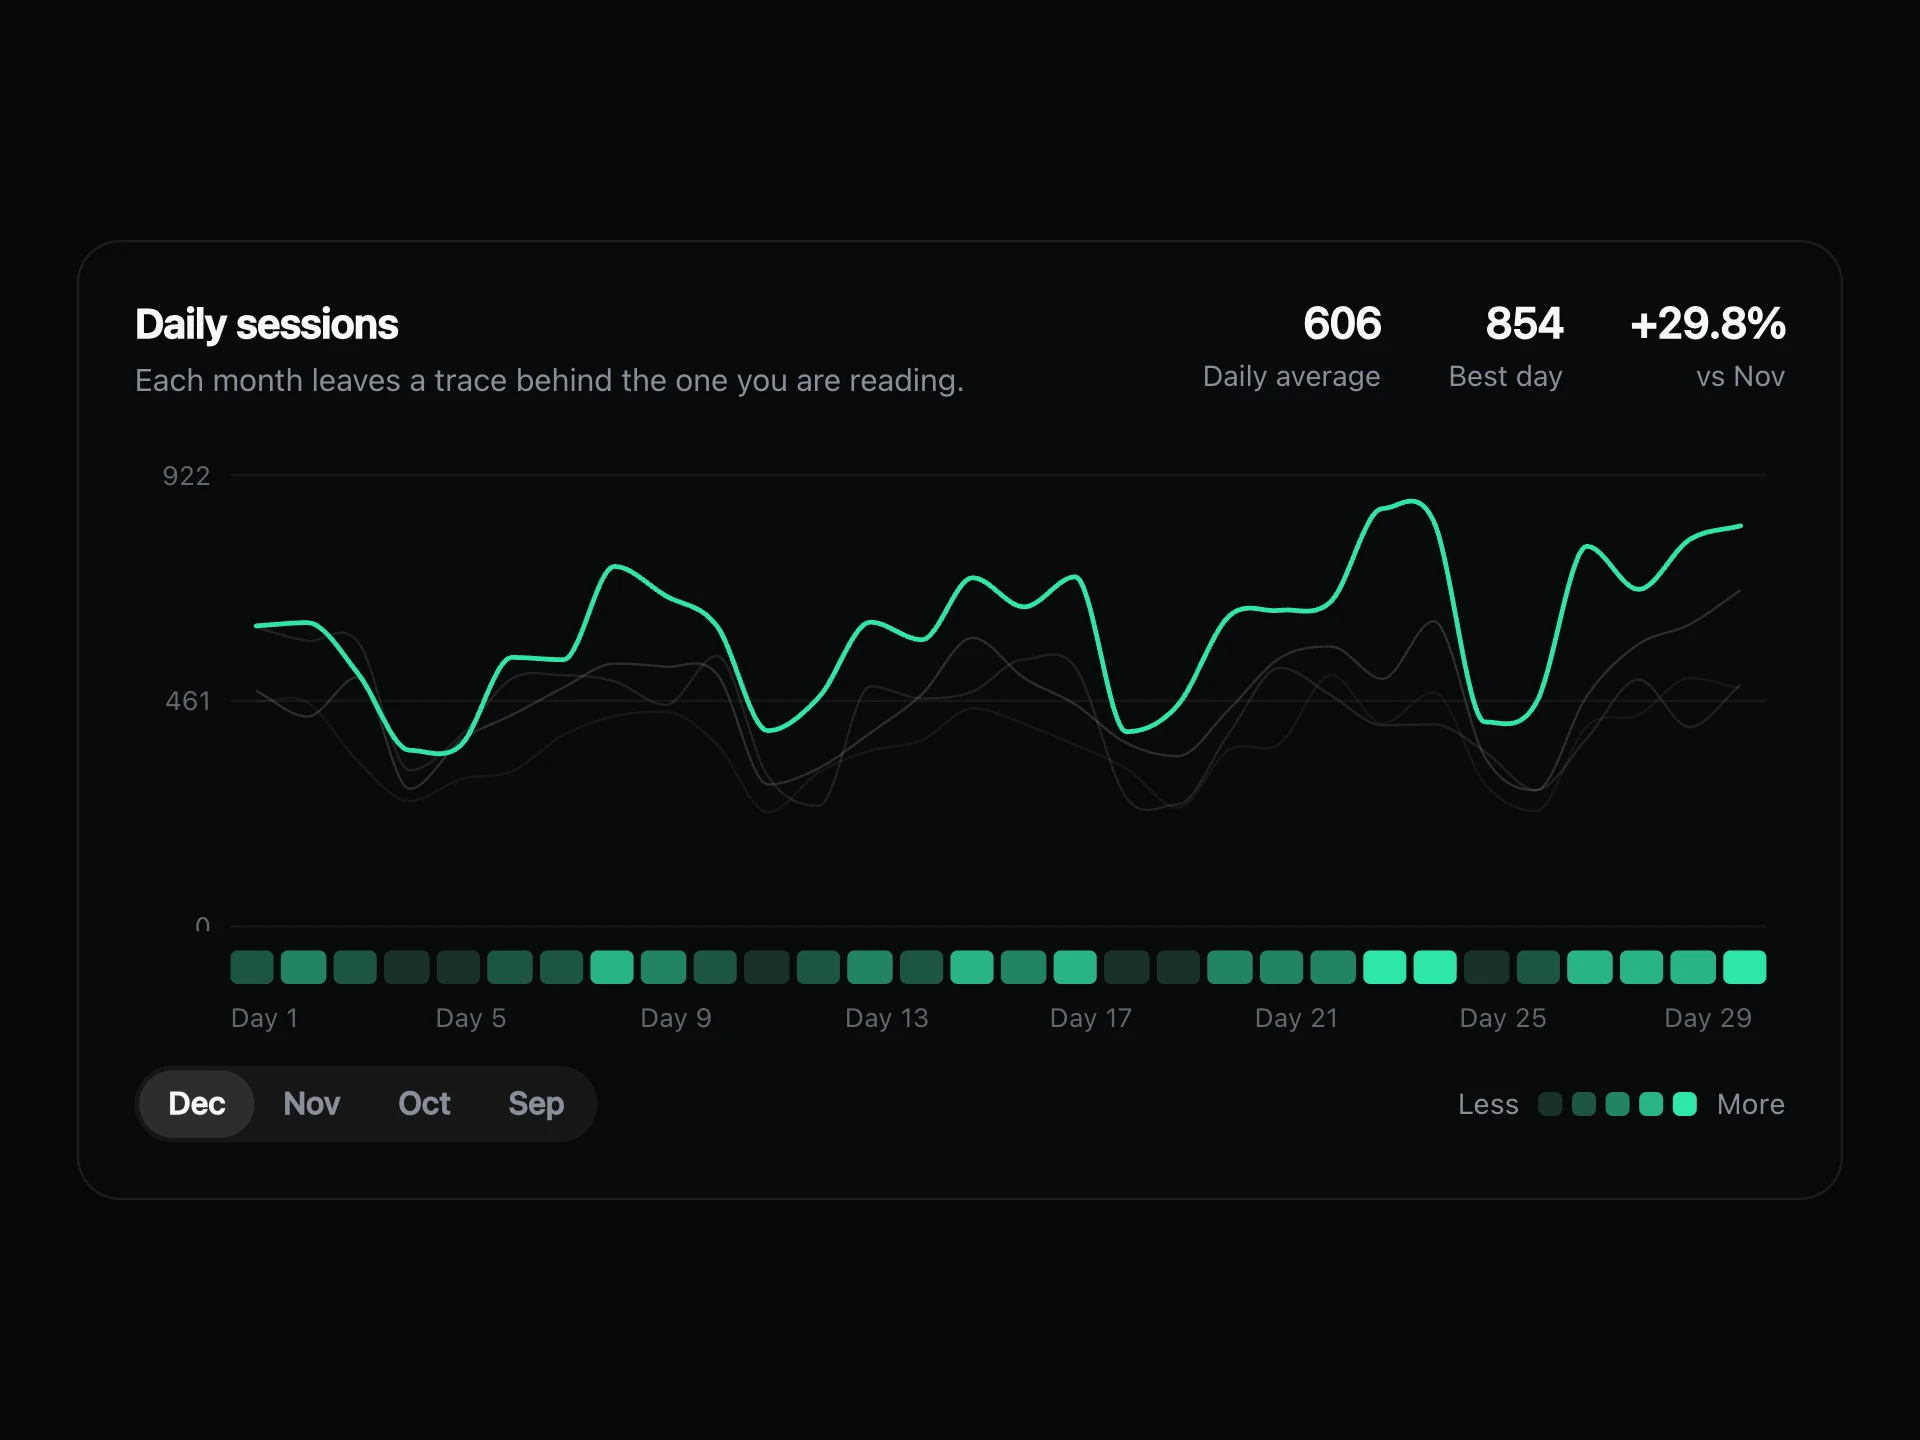
A live streaming line chart: a new reading every second glides in from the right, the scale eases to fit, readings over the alert threshold turn the line red, and a pulsing live badge, pause button and current / average / peak / alerts stats sit above it.
About the Realtime Line Chart component
Realtime Line Chart is a live monitor: a new reading arrives every second and glides in from the right while the scale eases to fit, so it feels smooth instead of jumpy. Readings over the alert threshold turn the line red, and the current value is tagged on the axis.
A pulsing Live badge, a Pause button and stats for the current value, window average, peak and number of alerts sit above it. It only ticks while it's on screen and the tab is visible.
When to use it
Use it for API latency and error rates, server CPU or memory, active users, order or event throughput, IoT sensors and trading tickers.
It shows the last minute or so; for history over hours or days, use a regular line chart with a range picker.
Installation
Add the Realtime Line Chart component to your project with the shadcn CLI. It lands in components/realtime-line-chart.tsx as plain React + Tailwind CSS source you own and can edit.
npx shadcn@latest add @reactframe/realtime-line-chartOr copy the source by hand and install its dependencies:
npm install clsx tailwind-mergeProps
<RealtimeLineChart /> accepts 13 props, all optional. It also accepts the usual <div> attributes, like className, style, id and aria-*, and passes them to its root element.
| Prop | Type | Default |
|---|---|---|
| theme | "dark" | "light" | "dark" |
| title | string | "API latency" |
| subtitle | string | "p95 across all regions, live" |
| next Produces the next value from the previous one. Defaults to a simulated latency feed. | (previous: number) => number | — |
| initial Values to start with (oldest first); the window is padded from these. | number[] | — |
| interval Milliseconds between points. | number | 1000 |
| windowSize How many points the window holds. | number | 60 |
| threshold Values above this are alerts: the line turns red and the counter goes up. | number | 180 |
| unit | string | "ms" |
| color | string | — |
| alertColor | string | — |
| height Height of the plot, in px. | number | 240 |
- theme"dark" | "light"Default: "dark"
- titlestringDefault: "API latency"
- subtitlestringDefault: "p95 across all regions, live"
- next
Produces the next value from the previous one. Defaults to a simulated latency feed.
(previous: number) => number - initial
Values to start with (oldest first); the window is padded from these.
number[] - interval
Milliseconds between points.
numberDefault: 1000 - windowSize
How many points the window holds.
numberDefault: 60 - threshold
Values above this are alerts: the line turns red and the counter goes up.
numberDefault: 180 - unitstringDefault: "ms"
- colorstring
- alertColorstring
- height
Height of the plot, in px.
numberDefault: 240
Show all 13 propsShow fewer
| formatValue | (value: number) => string | (v) => `${Math.round(v)}` |
- formatValue(value: number) => stringDefault: (v) => `${Math.round(v)}`
npm dependencies
Installed for you by the shadcn CLI.
Realtime Line Chart FAQ
- How do I feed it real data?
- Pass next: a function that returns the next value (it receives the previous one). Read from a ref that your WebSocket, SSE or polling code updates, and set interval to how often you want a new point.
- How long a window does it show?
- windowSize points × interval milliseconds; the defaults are 60 points every 1000ms, so the last minute.
- What happens above the threshold?
- The part of the line above threshold is drawn in alertColor, the badge and current value turn red, and the Alerts stat counts readings above it in the window.
- Does it keep running in the background?
- No. It pauses itself when it scrolls off screen or the tab is hidden, and visitors can pause it with the button. With reduced motion new points appear without gliding.