Marching Ants Line Chart React component
A line chart you measure by dragging: the range gets a marching ants outline, the stats follow it, and the forecast part of the line marches too.
About the Marching Ants Line Chart component
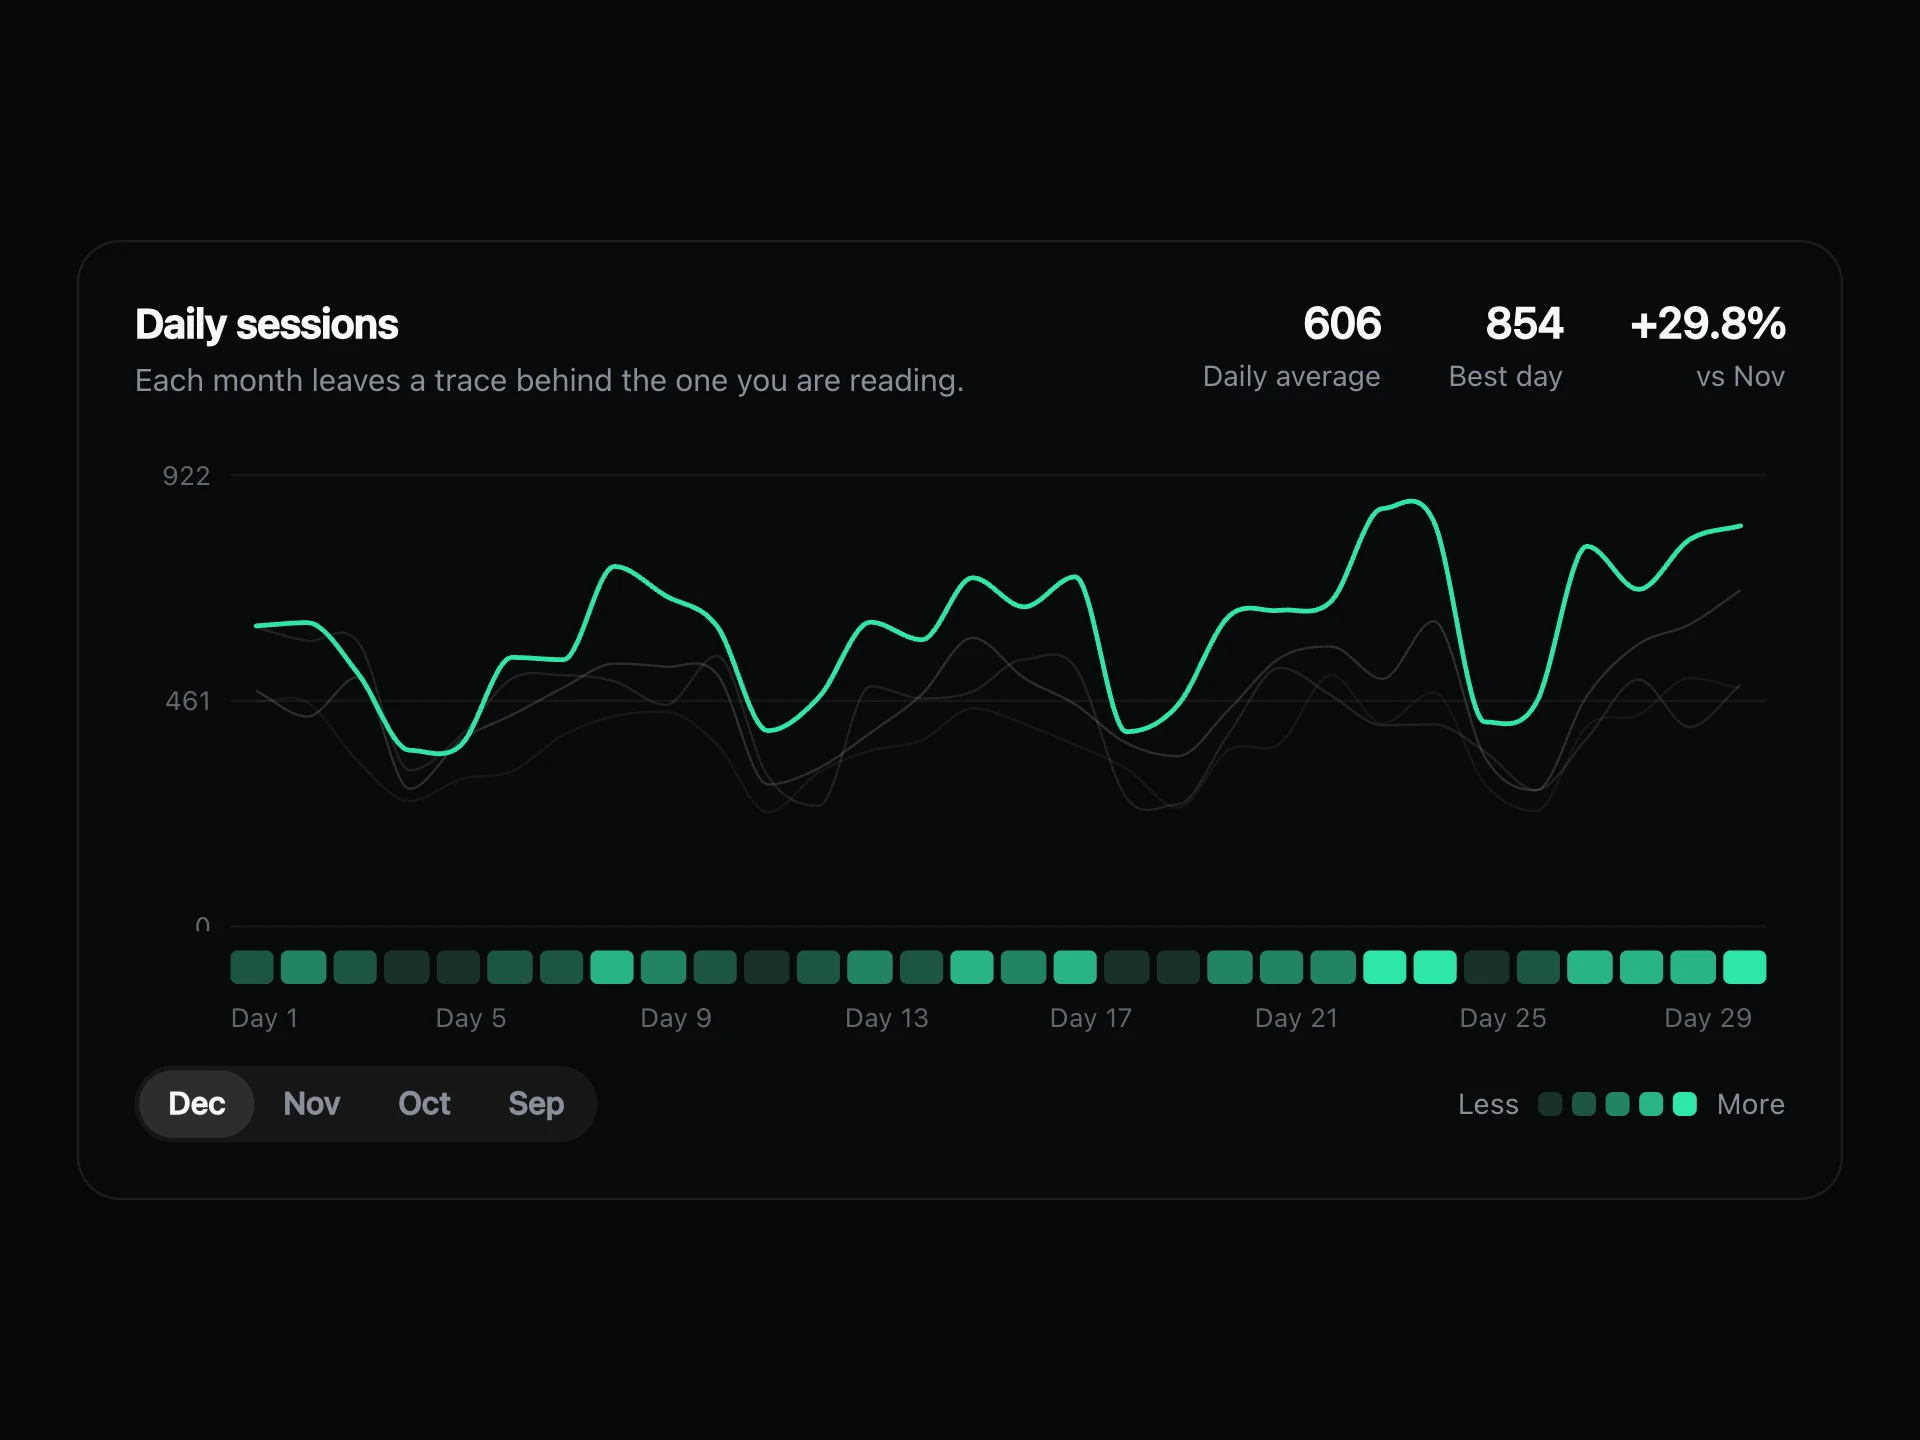
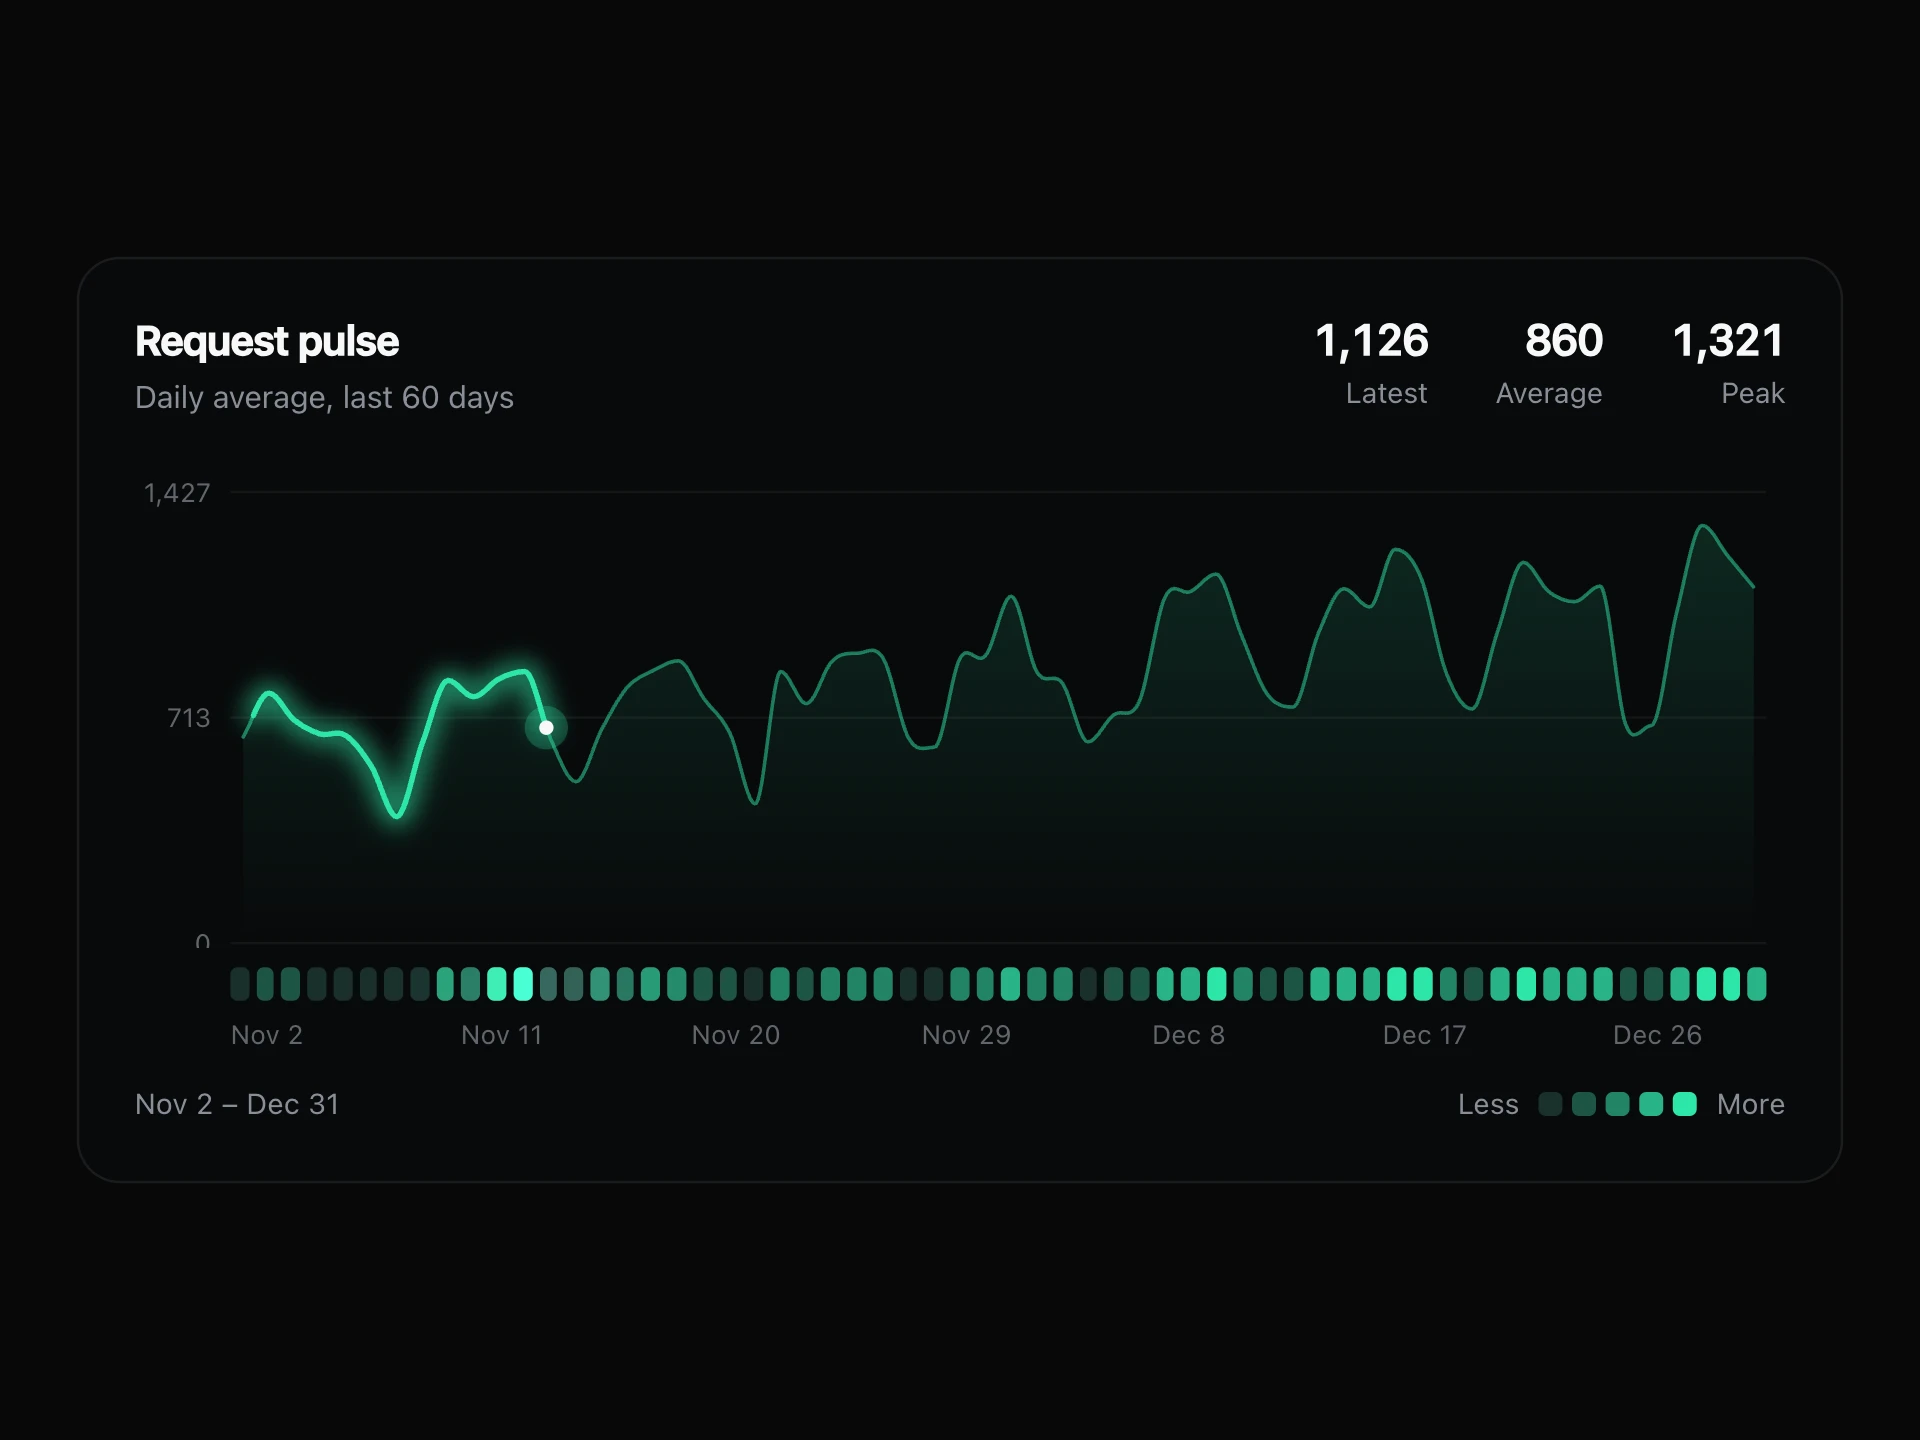
Marching Ants Line Chart turns reading a chart into measuring one. Drag across any stretch of the line and it gets the moving dashed outline you know from image editors, while the total, daily average and change at the top follow your selection.
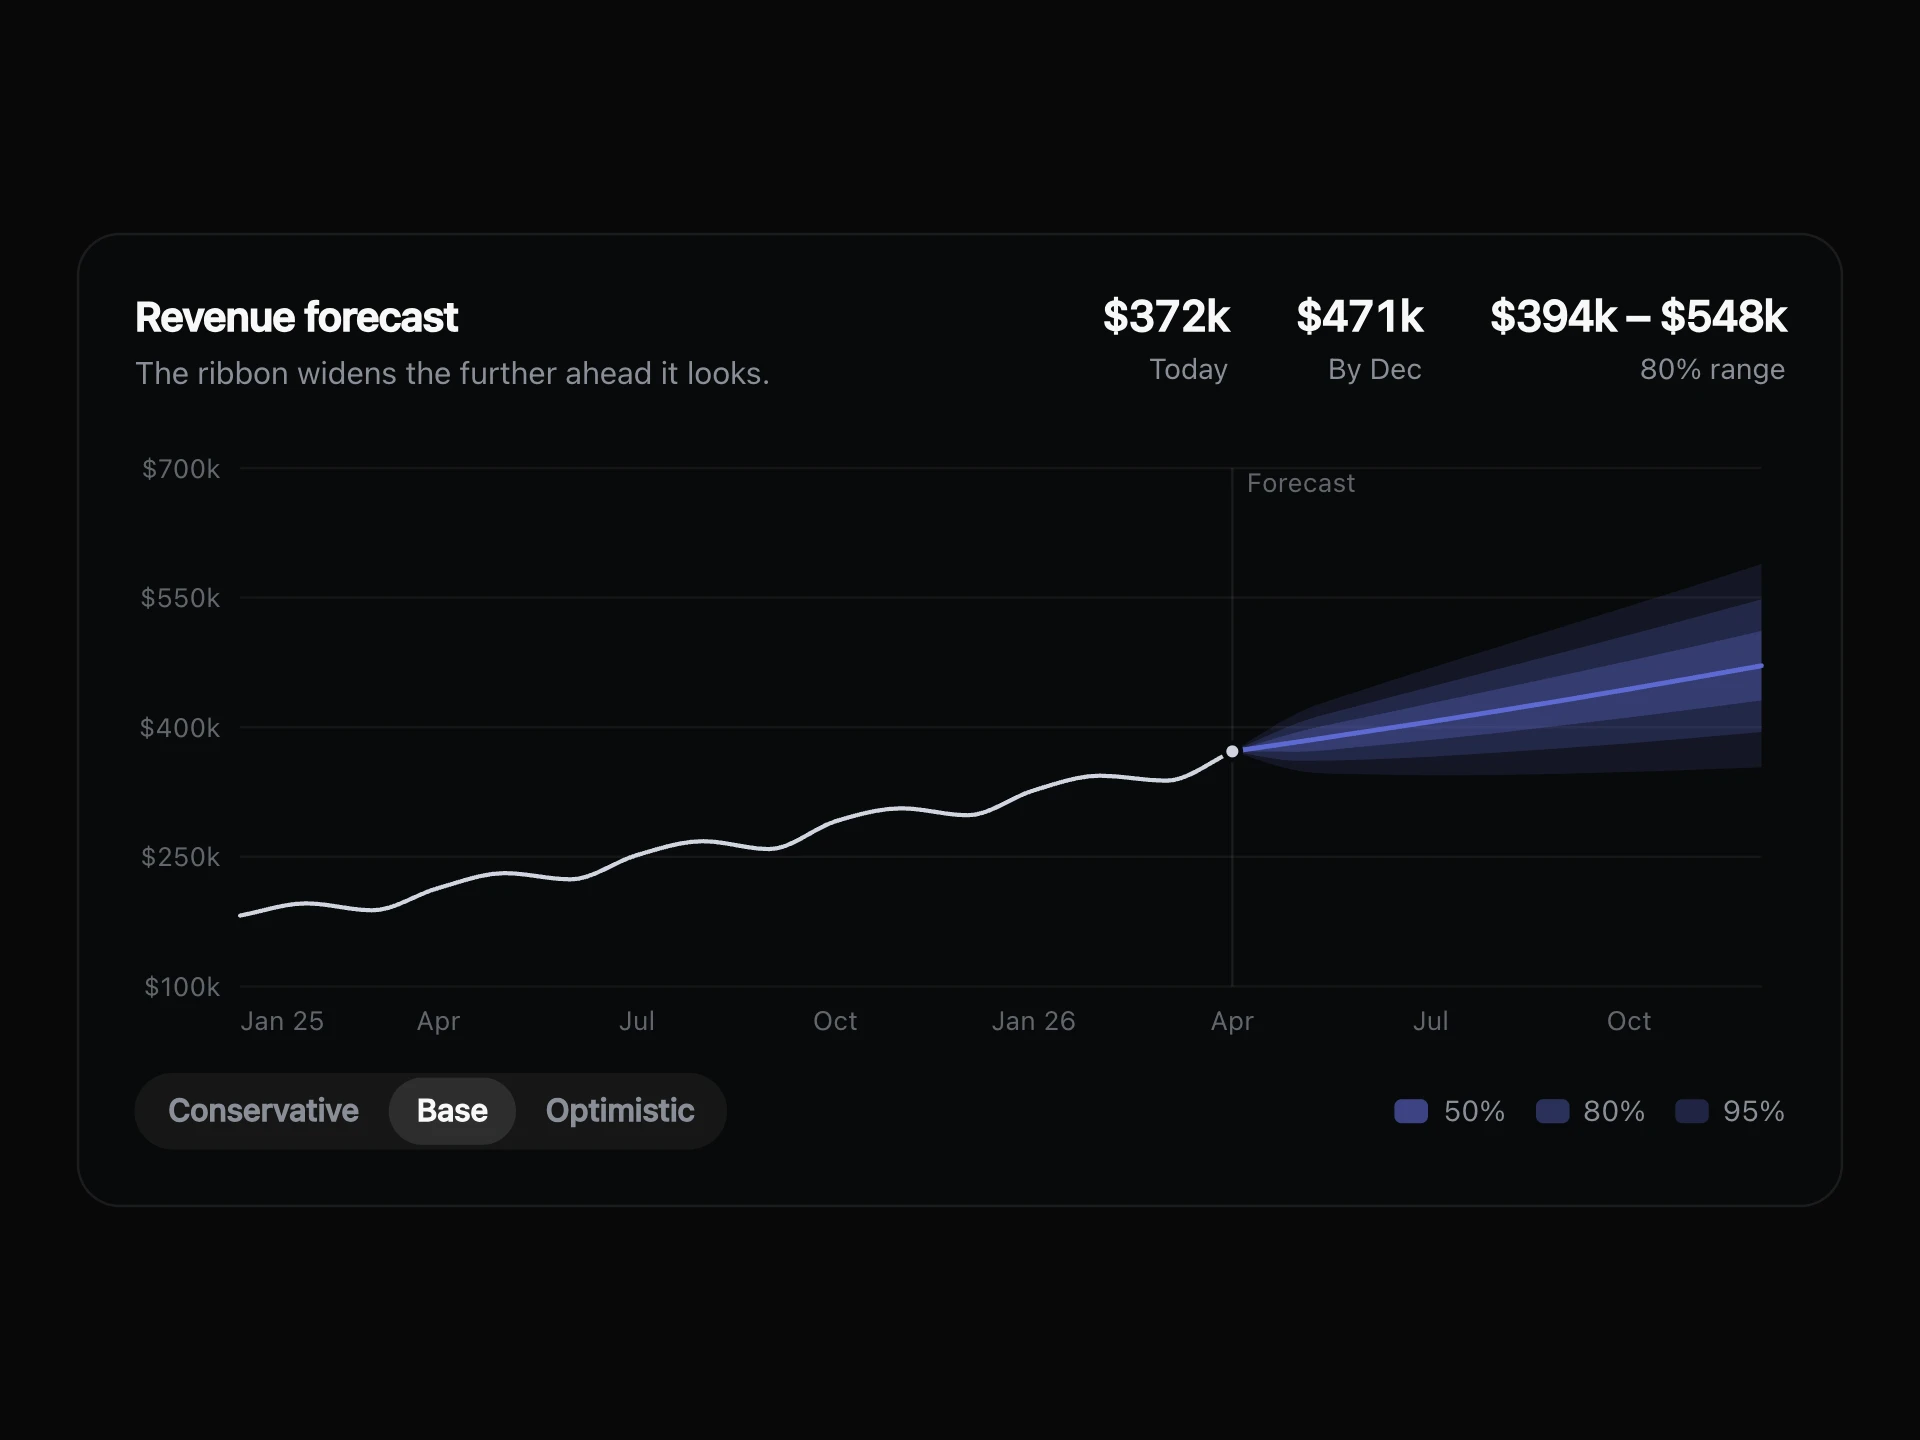
The same marching dash marks the forecast at the end of the line, so what has happened and what is expected never look alike. The heat cells outside your range dim, which keeps your eye on the part you picked.
When to use it
Use it for analytics where people ask how a campaign, release or season did, and need to compare any stretch of time by hand.
If people only ever look at fixed periods, tabs or a date picker will be quicker.
Installation
Add the Marching Ants Line Chart component to your project with the shadcn CLI. It lands in components/marching-ants-line-chart.tsx as plain React + Tailwind CSS source you own and can edit.
npx shadcn@latest add @reactframe/marching-ants-line-chartProps
<MarchingAntsLineChart /> accepts 10 props, all optional. It also accepts the usual <section> attributes, like className, style, id and aria-*, and passes them to its root element.
| Prop | Type | Default |
|---|---|---|
| theme | "dark" | "light" | "dark" |
| title | string | "Signups" |
| subtitle | string | "Drag across the chart to measure a range." |
| data | { date: string; value: number }[] | DEFAULT_DATA |
| forecast How many of the last points are a forecast, drawn as a marching line. | number | 12 |
| defaultRange Range selected at the start, as first and last index. Pass null for none. | [number, number] | null | [20, 36] |
| color Colour of the line, selection and cells. | string | — |
| height Height of the plot, in px. | number | 200 |
| formatValue | (value: number) => string | FORMAT |
| onRangeChange Called when the selection changes, with the selected points. | (points: AntsPoint[]) => void | — |
- theme"dark" | "light"Default: "dark"
- titlestringDefault: "Signups"
- subtitlestringDefault: "Drag across the chart to measure a range."
- data{ date: string; value: number }[]Default: DEFAULT_DATA
- forecast
How many of the last points are a forecast, drawn as a marching line.
numberDefault: 12 - defaultRange
Range selected at the start, as first and last index. Pass null for none.
[number, number] | nullDefault: [20, 36] - color
Colour of the line, selection and cells.
string - height
Height of the plot, in px.
numberDefault: 200 - formatValue(value: number) => stringDefault: FORMAT
- onRangeChange
Called when the selection changes, with the selected points.
(points: AntsPoint[]) => void
Marching Ants Line Chart FAQ
- How do I clear the selection?
- Click once on the chart, press Clear in the footer or press Escape.
- Can I set a range from code?
- defaultRange sets the first and last index to start with, and onRangeChange gives you the selected points each time it changes.
- Can I turn the forecast off?
- Yes. Pass forecast={0} and the whole line is solid.
- Does it work with a keyboard?
- Yes. Focus the chart, then use the arrow keys to move the range and Shift with the arrow keys to resize it.