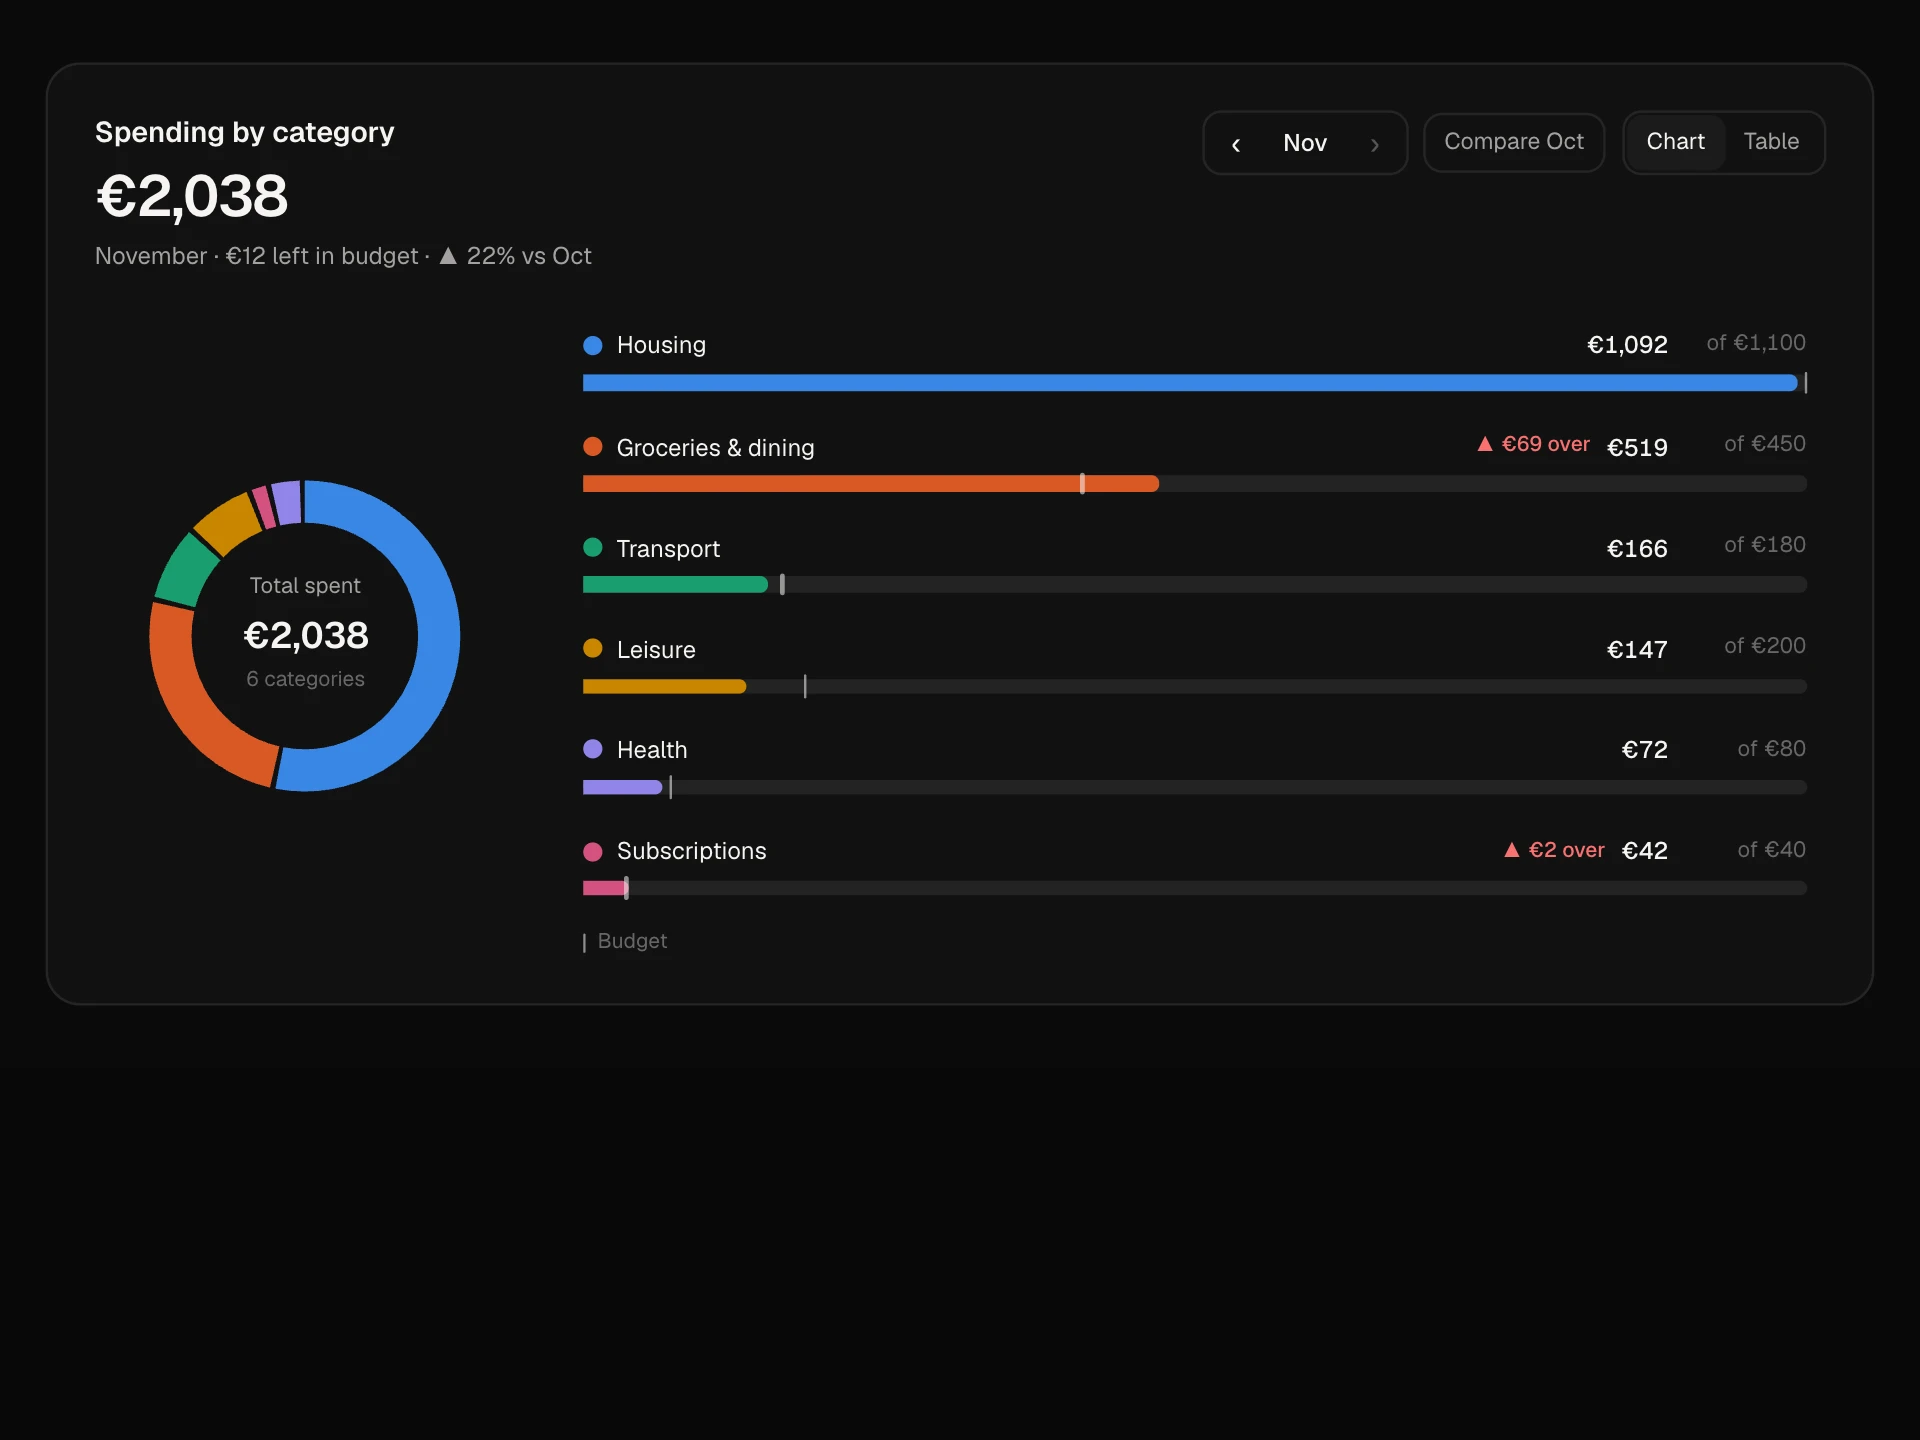
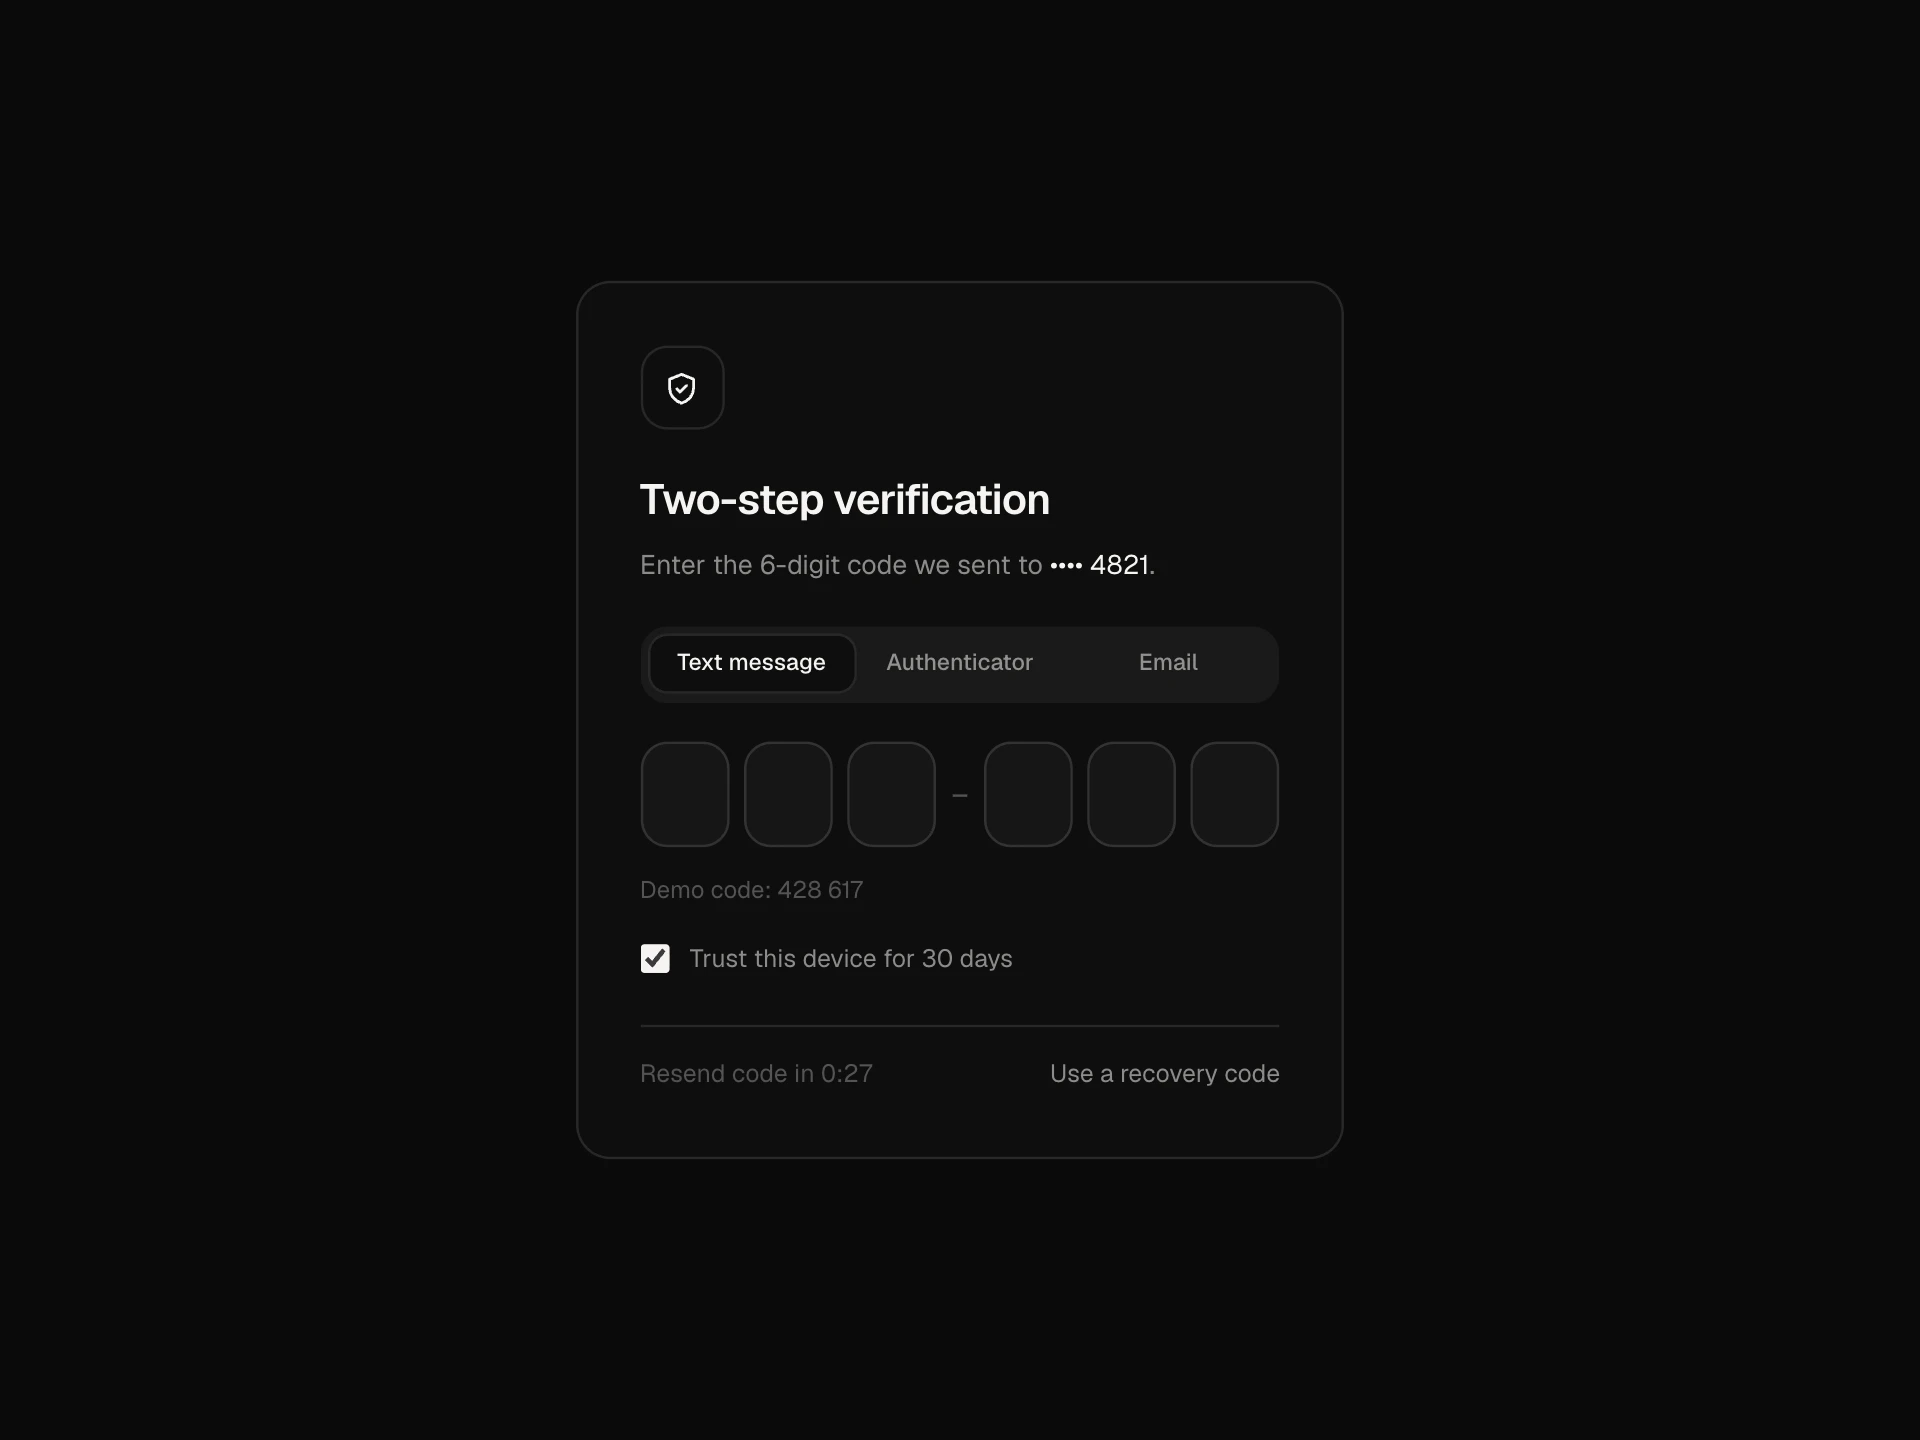
Campaign Performance Overview React component
A marketing campaign dashboard: channel filter and 7d / 30d / 90d range, six KPI tiles with change vs the previous period (four of them switch the chart), a daily line chart against a dashed previous period with crosshair tooltips, and a campaign list with budget pacing, ROAS, cost per conversion, sorting and pause / resume switches.
About the Campaign Performance Overview component
Campaign Performance Overview is the home screen of an ads or growth dashboard. The KPI row answers 'how are we doing?' with spend, clicks, conversions, revenue, ROAS and cost per conversion, each compared with the previous period and colored by whether the change is actually good.
Clicking a KPI swaps the daily chart to that metric, drawn against last period so trends are obvious, and the campaign list shows which campaigns are worth the money: budget pacing, ROAS and cost per conversion, with a switch to pause the ones that aren't.
When to use it
Use it in marketing, ads management and growth analytics products, or in agency client reports.
For a single metric over time use a line chart block; for a lead or deal pipeline use the Deals Pipeline Board.
Installation
Add the Campaign Performance Overview component to your project with the shadcn CLI. It lands in components/campaign-performance-overview.tsx as plain React + Tailwind CSS source you own and can edit.
npx shadcn@latest add @reactframe/campaign-performance-overviewOr copy the source by hand and install its dependencies:
npm install motion clsx tailwind-mergeProps
<CampaignPerformanceOverview /> accepts 5 props, all optional.
| Prop | Type | Default |
|---|---|---|
| campaigns | Campaign[] | CAMPAIGNS |
| currency | string | "€" |
| onToggle | (id: string, status: Campaign["status"]) => void | — |
| theme | "dark" | "light" | "dark" |
| className | string | — |
- campaignsCampaign[]Default: CAMPAIGNS
- currencystringDefault: "€"
- onToggle(id: string, status: Campaign["status"]) => void
- theme"dark" | "light"Default: "dark"
- classNamestring
npm dependencies
Installed for you by the shadcn CLI.
Campaign Performance Overview FAQ
- Where does the daily chart data come from?
- The demo spreads each total over the range with a deterministic curve. Replace curve() with your real daily series for the selected metric and the previous period.
- Why is a drop in spend shown in green?
- Each KPI knows which direction is good. Spend and cost per conversion going down is good; clicks, conversions, revenue and ROAS going up is good.
- How is ROAS calculated?
- Revenue divided by spend for the campaigns in view. Rows color it green at 3× and above and red under 2×; adjust those thresholds to your margins.
- How do I pause campaigns for real?
- onToggle(id, status) runs when a switch flips. Call your ads API there; the row dims while paused.
- Is it accessible?
- Range is a radiogroup, metric tiles are toggle buttons, the chart has a text label with the total, deltas use arrows as well as color, and campaign switches are labelled with the campaign name.